
NFC East · 2026 season
New York Giants depth chart and fantasy outlook
- Record
- 3-1
- Points/game
- 20.5
- Pace
- 18th fastest
- Next game
- Week 5 @ WAS · Sun 1:00 PM ET
More
What changed
Najee Harris carry share 7% → 30%; Jaxson Dart carry share 19% → 0% over the last 2 weeks.
Weeks 3 and 4 vs weeks 1, 2.
Target and carry tree
Each player’s share of the team’s targets and carries this season and over the last 3 weeks (arrows show the change vs the earlier weeks).
Targets
| Player | Tgt | Season share | Last 3 wk | Air yds |
|---|---|---|---|---|
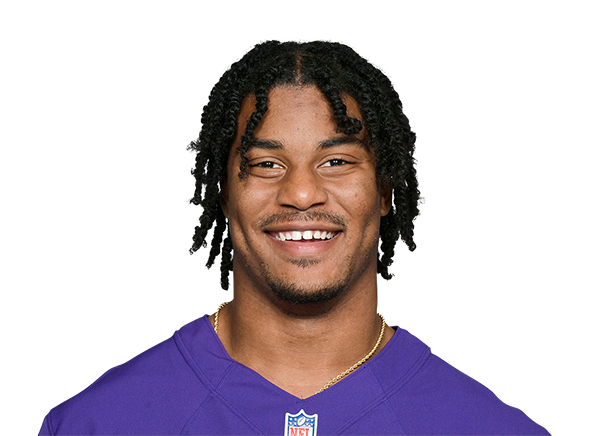 Isaiah LikelyTE Isaiah LikelyTE | 35 | 32% | 33%▲5 | 23% |
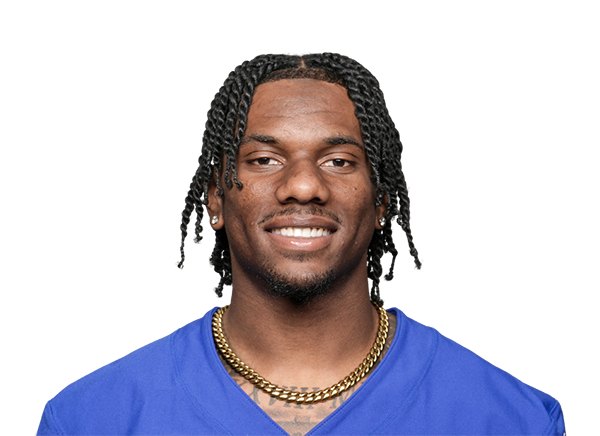 Malik NabersWR Malik NabersWR | 26 | 23% | 21%▼10 | 28% |
 Malachi FieldsWR Malachi FieldsWR | 15 | 14% | 13% | 26% |
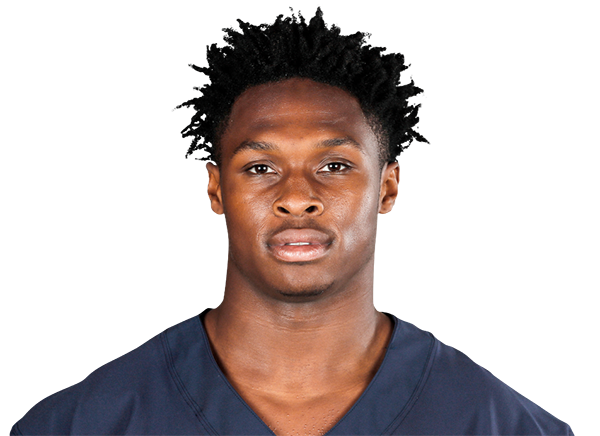 Darnell MooneyWR Darnell MooneyWR | 10 | 9% | 10%▲3 | 11% |
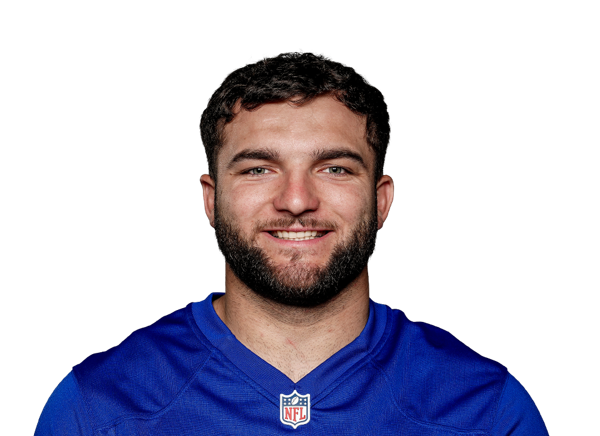 Cam SkatteboRB Cam SkatteboRB | 9 | 8% | 11%▲11 | 3% |
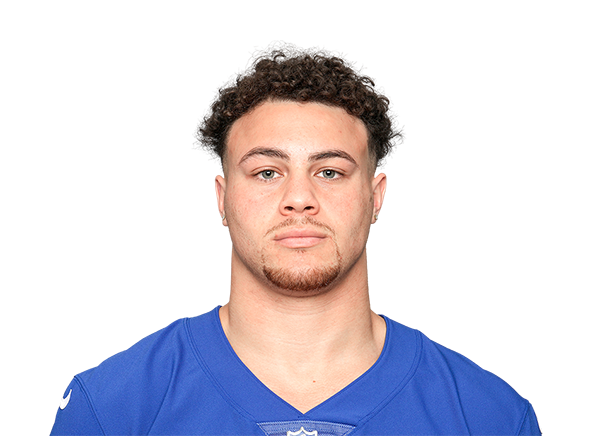 Theo JohnsonTE Theo JohnsonTE | 6 | 5% | 6%▲3 | 6% |
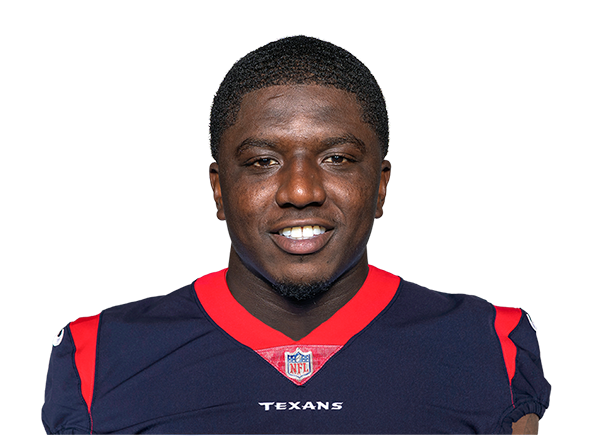 Devin SingletaryRB Devin SingletaryRB | 5 | 5% | 1%▼13 | 0% |
 Patrick RicardRB Patrick RicardRB | 3 | 3% | 2% | 0% |
Carries
| Player | Car | Season share | Last 3 wk |
|---|---|---|---|
| Cam SkatteboRB | 68 | 57% | 61%▲12 |
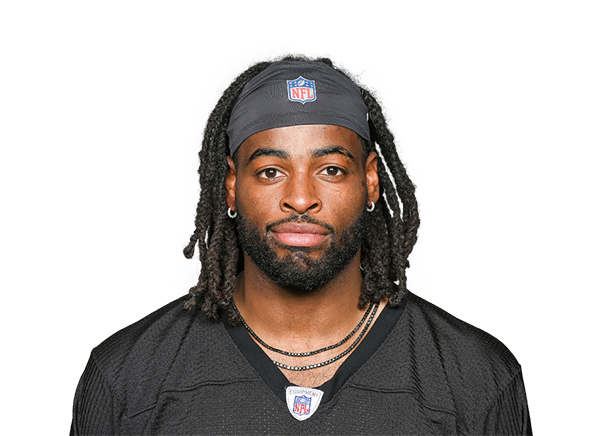 Najee HarrisRB Najee HarrisRB | 22 | 18% | 27%▲27 |
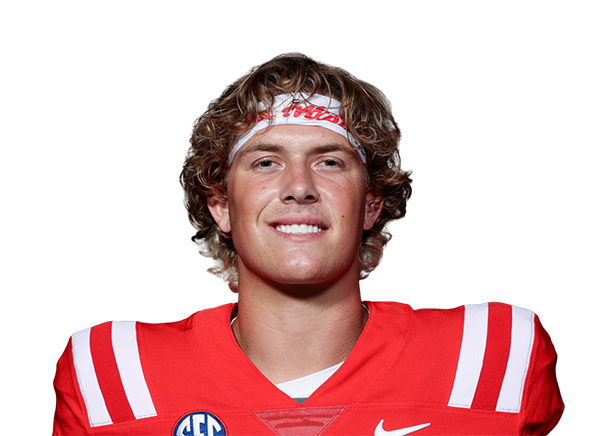 Jaxson DartQB Jaxson DartQB | 11 | 9% | 0%▼30 |
| Devin SingletaryRB | 9 | 8% | 4%▼13 |
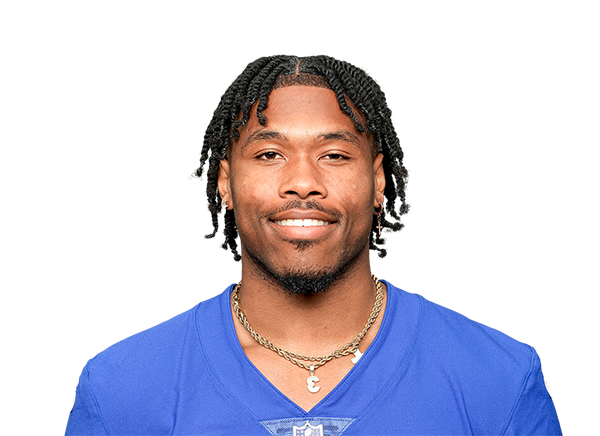 Tyrone Tracy Jr.RB Tyrone Tracy Jr.RB | 4 | 3% | 2%▼3 |
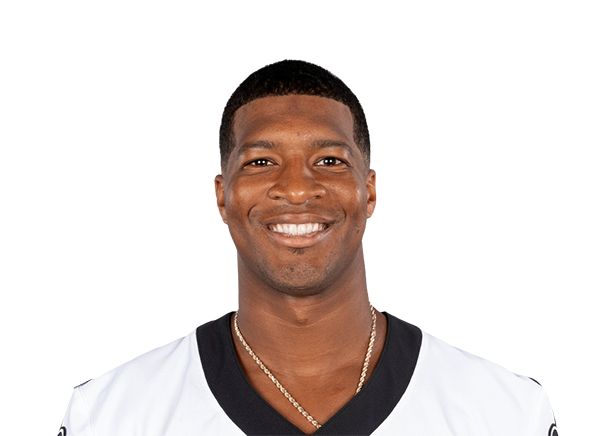 Jameis WinstonQB Jameis WinstonQB | 4 | 3% | 5%▲5 |
| Darnell MooneyWR | 1 | 1% | 1% |
Pace, pass rate and efficiency
Season averages with the Giants’ rank among 32 teams and the league average.
Plays per game
63.0
17th · league 64.1
Neutral seconds per play
31.9
18th · league 31.9
Neutral pass rate
50%
31st · league 58%
Pass rate over expected
-10.7
30th · league -1.6
Offense EPA/play
-0.05
23rd · league +0.01
Defense EPA/play allowed
+0.03
20th · league +0.01
Points per game
20.5
21st · league 23.1
Points allowed per game
19.8
8th · league 23.1
Depth chart
nflverse · updated Oct 6, 10:08 AM ET
Fantasy Nerds · updated Oct 6, 11:18 AM ET
- LWR
- 1.Malik Nabers2.Charlie Jones
- SWR
- 1.Darnell Mooney
Schedule and Vegas lines
| Wk | Opponent | Result / kickoff | Spread | Total | Implied |
|---|---|---|---|---|---|
| 1 | vsDAL | W 28-20 | +3 | 47.5 | 22.25 |
| 2 | @LAR | L 6-28 | +6.5 | 47.5 | 20.5 |
| 3 | vsTEN | W 12-7 | -2.5 | 37.5 | 20 |
| 4 | vsARI | W 36-24 | +2.5 | 44.5 | 21 |
| 5 | @WAS | Sun 1:00 PM ET, Oct 11 | +3 | 43.5 | 20.25 |
| 6 | vsNO | Sun 1:00 PM ET, Oct 18 | – | – | – |
| 7 | @HOU | Sun 1:00 PM ET, Oct 25 | – | – | – |
| 9 | @PHI | Sun 1:00 PM ET, Nov 8 | – | – | – |
| 10 | vsWAS | Thu 8:15 PM ET, Nov 12 | – | – | – |
| 11 | vsJAX | Sun 1:00 PM ET, Nov 22 | – | – | – |
| 12 | @IND | Sun 1:00 PM ET, Nov 29 | – | – | – |
| 13 | vsSF | Sun 1:00 PM ET, Dec 6 | – | – | – |
| 14 | @SEA | Sun 4:25 PM ET, Dec 13 | – | – | – |
| 15 | vsCLE | Sun 1:00 PM ET, Dec 20 | – | – | – |
| 16 | @DET | Mon 8:15 PM ET, Dec 28 | – | – | – |
| 17 | @DAL | Sun 1:00 PM ET, Jan 3 | – | – | – |
| 18 | vsPHI | Sun 1:00 PM ET, Jan 10 | – | – | – |
Closing lines for played games; current lines for upcoming games. Implied points = half the total plus or minus half the spread.
Injuries
Week 5 report
- Ben SaulsKQUndisclosed
- Braxton BerriosWRDFoot
- Brian BurnsLBIRKnee - Acl
- Calvin Austin IIIWRIRKnee
- Chauncey GolstonDEQNeck
- D.J. JamesCBQUndisclosed
- Gunner OlszewskiWRIRAchilles
- Jarrick Bernard-ConverseCBIRKnee
- Jason PinnockSAFQConcussion
- Jaxson DartQBIRKnee - Meniscus
- Korie BlackCBIRUndisclosed
- Paulson AdeboCBIRKnee
- Rico PaytonCBIRUndisclosed
- Roy Robertson-HarrisDEIRAchilles
- Thaddeus DixonCBIRAchilles
Fantasy points allowed
2026 season averages by position, not adjusted for opponents. Rank 1st = fewest allowed (toughest matchup).
| Pos | PPR allowed/G | League avg | Rank |
|---|---|---|---|
| QB | 15.3 | 16.8 | 13th |
| RB | 21.3 | 21.7 | 18th |
| WR | 33.1 | 32.5 | 17th |
| TE | 14.9 | 13.5 | 18th |
Adjusted for offenses faced (PPR): vs QB 18th · vs RB 26th · vs WR 14th · vs TE 14th. Defense vs positionNoisy this early in the season: weight it lightly.
How this works
Shares are the player’s targets or carries divided by the team total for the same weeks. Pace is the average seconds between snaps on the same drive in neutral situations; neutral pass rate counts plays while the game is competitive, so it reflects the play-caller’s preference rather than the score. EPA per play is the average expected points added (nflverse model).
The depth chart shows each source’s latest snapshot with its time, nflverse first. Fantasy points allowed sum what every opposing QB, RB, WR and TE scored, divided by games played.
Sources: nflverse play-by-play, Fantasy Nerds (depth chart)
Frequently asked questions
How fast do the Giants play?
The New York Giants average 31.9 seconds between snaps in neutral situations in 2026, 18th-fastest of 32 teams, and run 63.0 offensive plays per game. In neutral game situations they pass on 50% of plays (31st of 32).
Who leads the Giants in targets?
Isaiah Likely has 32% of the Giants’ targets in 2026. Cam Skattebo leads the backfield with 57% of the carries.
How good are the Giants on offense and defense?
By expected points added per play, the Giants offense ranks 23rd (-0.05) and the defense ranks 20th (+0.03 allowed) in 2026.