
2026 season · for Week 5
Spike-week upside: best ball and boom picks
Available players with the highest ceiling this week (90th percentile projection).
Spike-week upside: best ball and boom picks
| # | Why | |||
|---|---|---|---|---|
| 1 |  Jacoby BrissettARIQBvs DET Jacoby BrissettARIQBvs DET | 30.7 | 10% | 90th-percentile outcome 30.7 PPR vs a median of 17.5; vs DET (30th vs QB, generous). |
| 2 |  Aaron RodgersPITQBvs IND Aaron RodgersPITQBvs IND | 27.7 | 6% | 90th-percentile outcome 27.7 PPR vs a median of 15.8; vs IND. |
| 3 |  Kirk CousinsLVQB@ NE Kirk CousinsLVQB@ NE | 24.1 | 17% | 90th-percentile outcome 24.1 PPR vs a median of 13.5; @ NE (1st vs QB, stingy). |
| 4 | 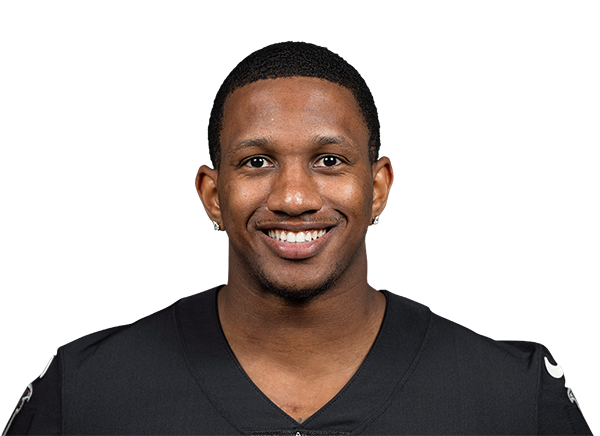 Michael Penix Jr.ATLQBvs BAL Michael Penix Jr.ATLQBvs BAL | 23.8 | 6% | 90th-percentile outcome 23.8 PPR vs a median of 13.1; vs BAL. |
| 5 |  Geno SmithNYJQBvs CLE Geno SmithNYJQBvs CLE | 23.7 | 9% | 90th-percentile outcome 23.7 PPR vs a median of 12.9; vs CLE. |
| 6 |  Deshaun WatsonCLEQB@ NYJ Deshaun WatsonCLEQB@ NYJ | 23.1 | 9% | 90th-percentile outcome 23.1 PPR vs a median of 13.2; @ NYJ (4th vs QB, stingy). |
| 7 |  Daniel JonesINDQB@ PIT Daniel JonesINDQB@ PIT | 22.6 | 23% | 90th-percentile outcome 22.6 PPR vs a median of 12.7; @ PIT. |
| 8 |  Jameis WinstonNYGQB@ WASRising Jameis WinstonNYGQB@ WASRising | 21.8 | 3% | 90th-percentile outcome 21.8 PPR vs a median of 11.9; @ WAS (31st vs QB, generous). |
| 9 |  Mack HollinsNEWRvs LVRising Mack HollinsNEWRvs LVRising | 21.5 | 13% | 90th-percentile outcome 21.5 PPR vs a median of 10.2; vs LV. |
| 10 | 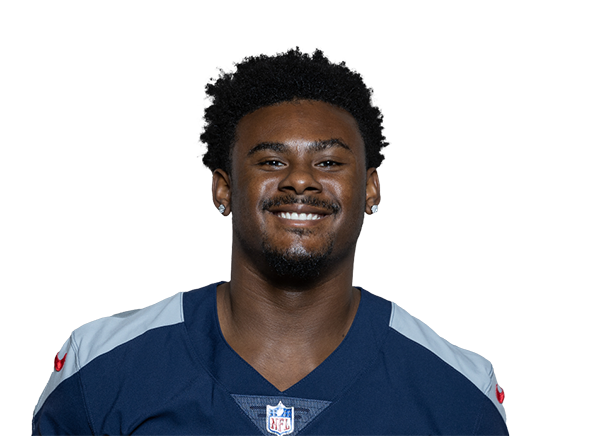 Malik WillisMIAQBvs CINRising Malik WillisMIAQBvs CINRising | 20.2 | 11% | 90th-percentile outcome 20.2 PPR vs a median of 10.9; vs CIN (25th vs QB, generous). |
| 11 | 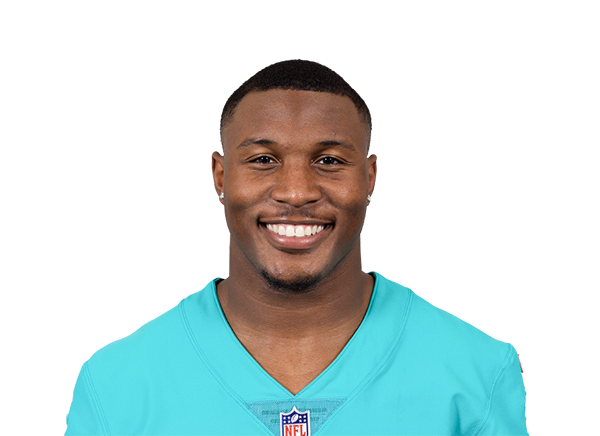 Malik WashingtonMIAWRvs CINRising Malik WashingtonMIAWRvs CINRising | 20.1 | 28% | 90th-percentile outcome 20.1 PPR vs a median of 9.7; vs CIN (8th vs WR, stingy). |
| 12 | 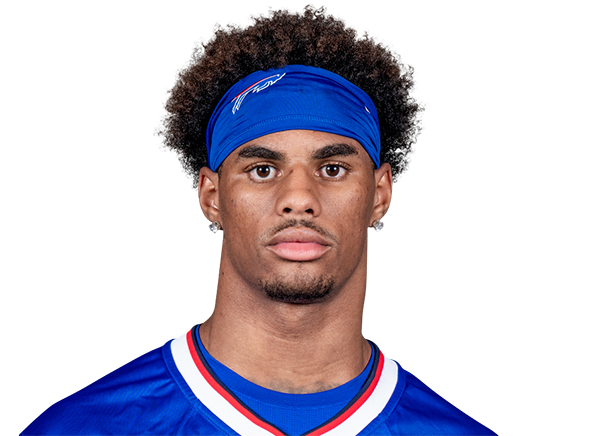 Keon ColemanBUFWR@ LAR Keon ColemanBUFWR@ LAR | 19.4 | 4% | 90th-percentile outcome 19.4 PPR vs a median of 8.5; @ LAR. |
| 13 |  Brenton StrangeJAXTEvs PHIRising Brenton StrangeJAXTEvs PHIRising | 19.0 | 17% | 90th-percentile outcome 19.0 PPR vs a median of 8.6; vs PHI (3rd vs TE, stingy). |
| 14 |  Tyson BagentCHIQB@ GBSurging Tyson BagentCHIQB@ GBSurging | 23.9 | 1% | 90th-percentile outcome 23.9 PPR vs a median of 13.3; @ GB (27th vs QB, generous). |
| 15 |  Cam WardTENQBvs HOU Cam WardTENQBvs HOU | 18.5 | 6% | 90th-percentile outcome 18.5 PPR vs a median of 10.1; vs HOU. |
| 16 |  Tyler AllgeierARIRBvs DET Tyler AllgeierARIRBvs DET | 18.4 | 28% | 90th-percentile outcome 18.4 PPR vs a median of 8.5; vs DET. |
| 17 |  Tyler HigbeeLARTEvs BUFSurging Tyler HigbeeLARTEvs BUFSurging | 17.3 | 2% | 90th-percentile outcome 17.3 PPR vs a median of 7.3; vs BUF (2nd vs TE, stingy). |
| 18 |  AJ BarnerSEATEvs SFSurging AJ BarnerSEATEvs SFSurging | 17.2 | 8% | 90th-percentile outcome 17.2 PPR vs a median of 7.6; vs SF. |
| 19 |  Ryan FlournoyDALWRvs TBSurging Ryan FlournoyDALWRvs TBSurging | 16.6 | 5% | 90th-percentile outcome 16.6 PPR vs a median of 7.5; vs TB (3rd vs WR, stingy). |
| 20 |  Tre HarrisLACWRvs DENRising Tre HarrisLACWRvs DENRising | 16.2 | 6% | 90th-percentile outcome 16.2 PPR vs a median of 7.2; vs DEN (6th vs WR, stingy). |
| 21 |  Cooper KuppSEAWRvs SF Cooper KuppSEAWRvs SF | 15.9 | 13% | 90th-percentile outcome 15.9 PPR vs a median of 6.6; vs SF. |
| 22 |  Cade OttonTBTE@ DAL Cade OttonTBTE@ DAL | 15.8 | 3% | 90th-percentile outcome 15.8 PPR vs a median of 7.5; @ DAL. |
| 23 |  Oronde Gadsden IILACTEvs DENRising Oronde Gadsden IILACTEvs DENRising | 15.8 | 7% | 90th-percentile outcome 15.8 PPR vs a median of 7.1; vs DEN. |
| 24 |  Rashod BatemanBALWR@ ATL Rashod BatemanBALWR@ ATL | 15.7 | 24% | 90th-percentile outcome 15.7 PPR vs a median of 6.9; @ ATL. |
| 25 |  Roman WilsonPITWRvs INDRising Roman WilsonPITWRvs INDRising | 15.4 | 4% | 90th-percentile outcome 15.4 PPR vs a median of 6.7; vs IND. |
How this works
This week’s 90th-percentile projection: the spike outcome best ball and boom-or-bust lineups want.
League size sets who counts as available: rostered in under 50% (10-team), 35% (12-team) or 10% (14+ team) of ESPN leagues. Enter your Sleeper league to see only players nobody in it has rostered. Points follow your scoring format.
Sources: Edgehalla projections, ESPN rostered %, nflverse scheduleUpdated Mon, Oct 5, 8:00 PM ET
Frequently asked questions
How is the spike weeks (best ball) list ranked?
This week’s 90th-percentile projection: the spike outcome best ball and boom-or-bust lineups want.
How do I see only players available in my league?
Paste your Sleeper league ID or URL above the list. We read your league’s rosters from Sleeper and hide everyone already on a team. ESPN and Yahoo leagues use the league-size filter instead.