
AFC West · 2026 season
Kansas City Chiefs depth chart and fantasy outlook
- Record
- 4-0
- Points/game
- 29.5
- Pace
- 7th fastest
- Next game
- Week 6 vs LAC · Sun 4:25 PM ET
More
What changed
Kenneth Walker III target share 24% → 6%; Tyquan Thornton target share 7% → 20% over the last 2 weeks.
Weeks 3 and 4 vs weeks 1, 2.
Target and carry tree
Each player’s share of the team’s targets and carries this season and over the last 3 weeks (arrows show the change vs the earlier weeks).
Targets
| Player | Tgt | Season share | Last 3 wk | Air yds |
|---|---|---|---|---|
 Travis KelceTE Travis KelceTE | 22 | 19% | 18% | 15% |
 Xavier WorthyWR Xavier WorthyWR | 22 | 19% | 17%▼7 | 24% |
 Kenneth Walker IIIRB Kenneth Walker IIIRB | 19 | 16% | 14%▼10 | 1% |
 Rashee RiceWR Rashee RiceWR | 17 | 14% | 16%▲8 | 14% |
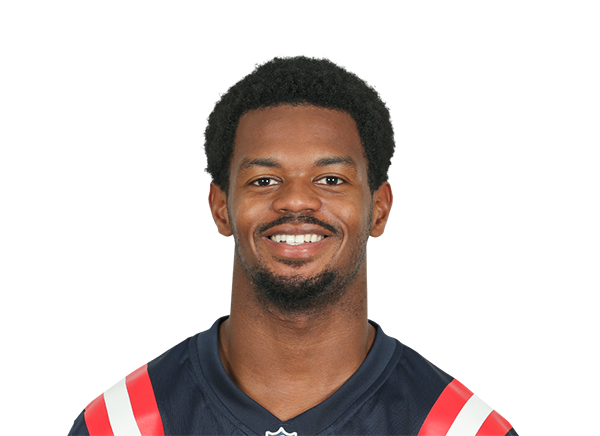 Tyquan ThorntonWR Tyquan ThorntonWR | 15 | 13% | 15%▲11 | 32% |
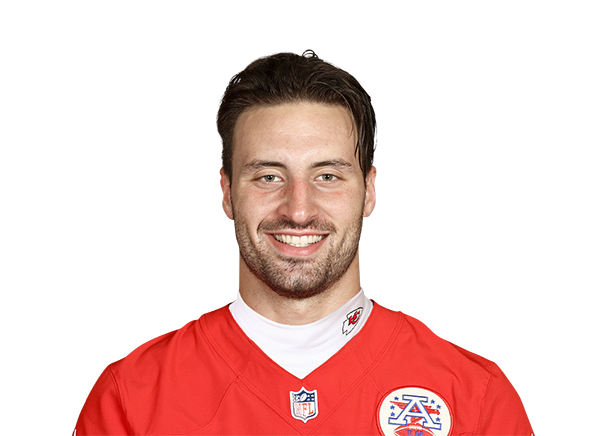 Noah GrayTE Noah GrayTE | 8 | 7% | 8%▲4 | 6% |
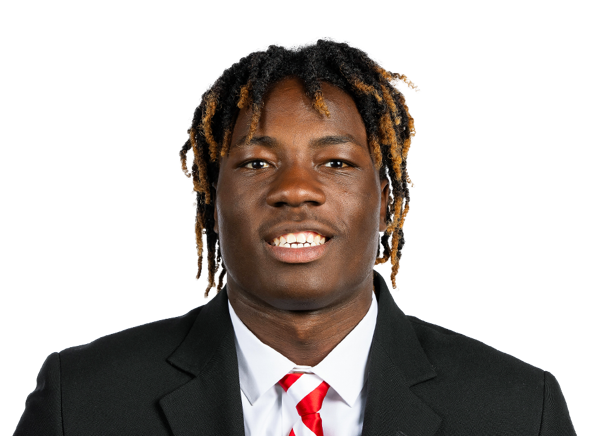 Emmett JohnsonRB Emmett JohnsonRB | 5 | 4% | 3%▼5 | 0% |
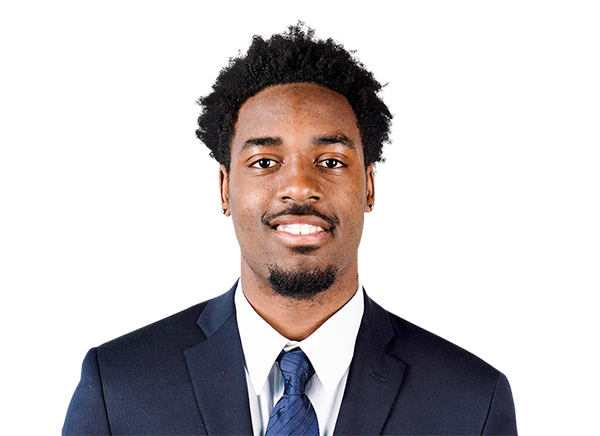 Jalen RoyalsWR Jalen RoyalsWR | 5 | 4% | 5%▲5 | 3% |
Carries
| Player | Car | Season share | Last 3 wk |
|---|---|---|---|
| Kenneth Walker IIIRB | 87 | 76% | 83%▲23 |
| Emmett JohnsonRB | 16 | 14% | 10%▼11 |
 Patrick MahomesQB Patrick MahomesQB | 12 | 10% | 6%▼12 |
Pace, pass rate and efficiency
Season averages with the Chiefs’ rank among 32 teams and the league average.
Plays per game
64.3
14th · league 64.1
Neutral seconds per play
31.1
7th · league 31.9
Neutral pass rate
58%
18th · league 58%
Pass rate over expected
+1.6
11th · league -1.6
Offense EPA/play
+0.16
4th · league +0.01
Defense EPA/play allowed
-0.04
9th · league +0.01
Points per game
29.5
6th · league 23.1
Points allowed per game
19.3
6th · league 23.1
Depth chart
nflverse · updated Oct 6, 10:08 AM ET
Fantasy Nerds · updated Oct 6, 11:18 AM ET
- LWR
- 1.Tyquan Thornton2.Jalen Royals
- RWR
- 1.Xavier Worthy2.Nikko Remigio
- SWR
- 1.Rashee Rice2.Cyrus Allen
Schedule and Vegas lines
| Wk | Opponent | Result / kickoff | Spread | Total | Implied |
|---|---|---|---|---|---|
| 1 | vsDEN | W 31-10 | -2.5 | 42.5 | 22.5 |
| 2 | vsIND | W 33-30 | -6 | 46.5 | 26.25 |
| 3 | @MIA | W 24-10 | -10 | 45.5 | 27.75 |
| 4 | @LV | W 30-27 | -4.5 | 47.5 | 26 |
| 6 | vsLAC | Sun 4:25 PM ET, Oct 18 | – | – | – |
| 7 | @SEA | Sun 8:20 PM ET, Oct 25 | – | – | – |
| 8 | @DEN | Sun 4:25 PM ET, Nov 1 | – | – | – |
| 9 | vsNYJ | Sun 1:00 PM ET, Nov 8 | – | – | – |
| 10 | @ATL | Sun 1:00 PM ET, Nov 15 | – | – | – |
| 11 | vsARI | Sun 1:00 PM ET, Nov 22 | – | – | – |
| 12 | @BUF | Thu 8:20 PM ET, Nov 26 | – | – | – |
| 13 | @LAR | Thu 8:15 PM ET, Dec 3 | – | – | – |
| 14 | @CIN | Sun 4:25 PM ET, Dec 13 | – | – | – |
| 15 | vsNE | Mon 8:15 PM ET, Dec 21 | – | – | – |
| 16 | vsSF | Sun 4:25 PM ET, Dec 27 | – | – | – |
| 17 | @LAC | Sun 1:00 PM ET, Jan 3 | – | – | – |
| 18 | vsLV | Sun 1:00 PM ET, Jan 10 | – | – | – |
Closing lines for played games; current lines for upcoming games. Implied points = half the total plus or minus half the spread.
Injuries
Week 5 report
- C.J. HansonGQUndisclosed
- Chris OladokunQBQUndisclosed
- Cooper McDonaldLBIRKnee
- Deon BushDBQAchilles
- EJ SmithRBQUndisclosed
- Ethan DownsLBIRKnee - Acl
- Jeff CaldwellWRIRKnee
- Jimmy HolidayWRIRUndisclosed
- John Michael GyllenborgTEIRKnee
- Josh SimmonsOTQBack
- Matt WaletzkoOTIRUndisclosed
- Omarr Norman-LottDTPUPKnee - Acl
- Rashee RiceWRQHamstring
- Tyquan ThorntonWROAnkle
Fantasy points allowed
2026 season averages by position, not adjusted for opponents. Rank 1st = fewest allowed (toughest matchup).
| Pos | PPR allowed/G | League avg | Rank |
|---|---|---|---|
| QB | 12.4 | 16.8 | 4th · tough |
| RB | 20.0 | 21.7 | 13th |
| WR | 21.4 | 32.5 | 1st · tough |
| TE | 22.6 | 13.5 | 31st · soft |
Adjusted for offenses faced (PPR): vs QB 10th · vs RB 6th · vs WR 7th · vs TE 27th. Defense vs positionNoisy this early in the season: weight it lightly.
How this works
Shares are the player’s targets or carries divided by the team total for the same weeks. Pace is the average seconds between snaps on the same drive in neutral situations; neutral pass rate counts plays while the game is competitive, so it reflects the play-caller’s preference rather than the score. EPA per play is the average expected points added (nflverse model).
The depth chart shows each source’s latest snapshot with its time, nflverse first. Fantasy points allowed sum what every opposing QB, RB, WR and TE scored, divided by games played.
Sources: nflverse play-by-play, Fantasy Nerds (depth chart)
Frequently asked questions
How fast do the Chiefs play?
The Kansas City Chiefs average 31.1 seconds between snaps in neutral situations in 2026, 7th-fastest of 32 teams, and run 64.3 offensive plays per game. In neutral game situations they pass on 58% of plays (18th of 32).
Who leads the Chiefs in targets?
Travis Kelce has 19% of the Chiefs’ targets in 2026. Kenneth Walker III leads the backfield with 76% of the carries.
How good are the Chiefs on offense and defense?
By expected points added per play, the Chiefs offense ranks 4th (+0.16) and the defense ranks 9th (-0.04 allowed) in 2026.