
2026 season · Rest of season
Rest of Season Fantasy Football Projections (Half PPR)
Expected Half PPR points for the rest of the regular season, summed week by week with byes skipped and each game weighted by the chance he plays.
Rest of season projections
| # | Player | G | ROS Half |
|---|---|---|---|
| 1 |  Jahmyr GibbsDETRB Jahmyr GibbsDETRB | 13 | 266.9 |
| 2 |  Bijan RobinsonATLRB Bijan RobinsonATLRB | 13 | 266.4 |
| 3 |  Kenneth Walker IIIKCRB Kenneth Walker IIIKCRB | 13 | 230.3 |
| 4 |  Josh AllenBUFQB Josh AllenBUFQB | 13 | 225.2 |
| 5 |  Joe BurrowCINQB Joe BurrowCINQB | 13 | 222.9 |
| 6 |  Brock PurdySFQB Brock PurdySFQB | 13 | 222.8 |
| 7 |  Tyler ShoughNOQB Tyler ShoughNOQB | 13 | 222.4 |
| 8 |  Dak PrescottDALQB Dak PrescottDALQB | 13 | 221.6 |
| 9 |  Aaron JonesMINRB Aaron JonesMINRB | 13 | 221.0 |
| 10 |  Jaxon Smith-NjigbaSEAWR Jaxon Smith-NjigbaSEAWR | 13 | 218.3 |
| 11 |  Deshaun WatsonCLEQB Deshaun WatsonCLEQB | 13 | 215.6 |
| 12 |  Bryce YoungCARQB Bryce YoungCARQB | 13 | 214.1 |
| 13 |  Jonathan TaylorINDRB Jonathan TaylorINDRB | 13 | 214.1 |
| 14 |  Derrick HenryBALRB Derrick HenryBALRB | 13 | 213.1 |
| 15 |  Drake MayeNEQB Drake MayeNEQB | 13 | 212.0 |
| 16 |  Tetairoa McMillanCARWR Tetairoa McMillanCARWR | 13 | 211.7 |
| 17 |  Christian McCaffreySFRB Christian McCaffreySFRB | 13 | 210.6 |
| 18 |  Jaylen WarrenPITRB Jaylen WarrenPITRB | 13 | 210.1 |
| 19 |  Matthew StaffordLARQB Matthew StaffordLARQB | 13 | 209.7 |
| 20 |  Lamar JacksonBALQB Lamar JacksonBALQB | 13 | 208.8 |
| 21 |  Trevor LawrenceJAXQB Trevor LawrenceJAXQB | 13 | 208.6 |
| 22 |  Jared GoffDETQB Jared GoffDETQB | 13 | 207.3 |
| 23 |  Jacoby BrissettARIQB Jacoby BrissettARIQB | 13 | 205.8 |
| 24 |  Patrick MahomesKCQB Patrick MahomesKCQB | 13 | 205.6 |
| 25 |  Jalen HurtsPHIQB Jalen HurtsPHIQB | 13 | 203.8 |
| 26 |  Javonte WilliamsDALRB Javonte WilliamsDALRB | 13 | 203.6 |
| 27 |  Bo NixDENQB Bo NixDENQB | 13 | 203.2 |
| 28 |  Chuba HubbardCARRB Chuba HubbardCARRB | 13 | 201.8 |
| 29 |  C.J. StroudHOUQB C.J. StroudHOUQB | 13 | 201.2 |
| 30 |  Chris OlaveNOWR Chris OlaveNOWR | 13 | 200.2 |
| 31 |  Kirk CousinsLVQB Kirk CousinsLVQB | 13 | 198.6 |
| 32 |  James CookBUFRB James CookBUFRB | 13 | 198.4 |
| 33 |  Jordan LoveGBQB Jordan LoveGBQB | 13 | 197.2 |
| 34 |  Kyren WilliamsLARRB Kyren WilliamsLARRB | 13 | 196.9 |
| 35 |  Justin HerbertLACQB Justin HerbertLACQB | 13 | 196.5 |
| 36 |  Chase BrownCINRB Chase BrownCINRB | 13 | 196.1 |
| 37 |  Aaron RodgersPITQB Aaron RodgersPITQB | 13 | 195.1 |
| 38 |  CeeDee LambDALWR CeeDee LambDALWR | 13 | 192.8 |
| 39 |  Sam DarnoldSEAQB Sam DarnoldSEAQB | 13 | 191.7 |
| 40 |  Kyler MurrayMINQB Kyler MurrayMINQB | 13 | 186.3 |
| 41 |  Ashton JeantyLVRB Ashton JeantyLVRB | 13 | 184.3 |
| 42 |  D'Andre SwiftCHIRB D'Andre SwiftCHIRB | 13 | 183.6 |
| 43 | 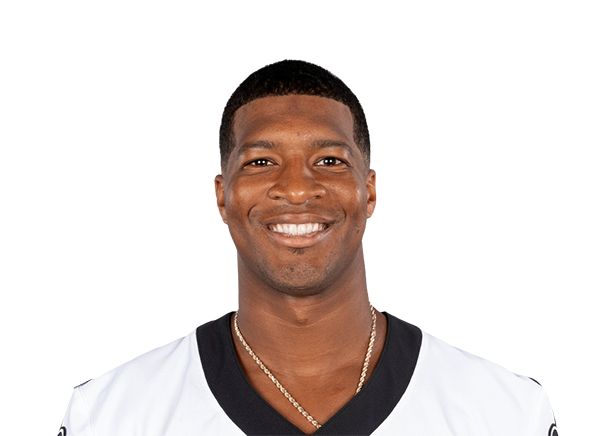 Jameis WinstonNYGQB Jameis WinstonNYGQB | 13 | 181.9 |
| 44 |  Daniel JonesINDQB Daniel JonesINDQB | 13 | 181.0 |
| 45 | 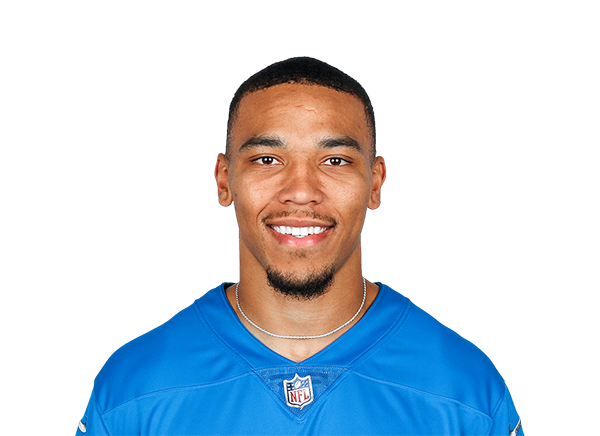 Amon-Ra St. BrownDETWR Amon-Ra St. BrownDETWR | 13 | 180.5 |
| 46 |  Zay FlowersBALWR Zay FlowersBALWR | 13 | 179.2 |
| 47 |  Geno SmithNYJQB Geno SmithNYJQB | 13 | 178.2 |
| 48 |  Cam WardTENQB Cam WardTENQB | 13 | 176.5 |
| 49 |  Puka NacuaLARWR Puka NacuaLARWR | 13 | 175.1 |
| 50 | 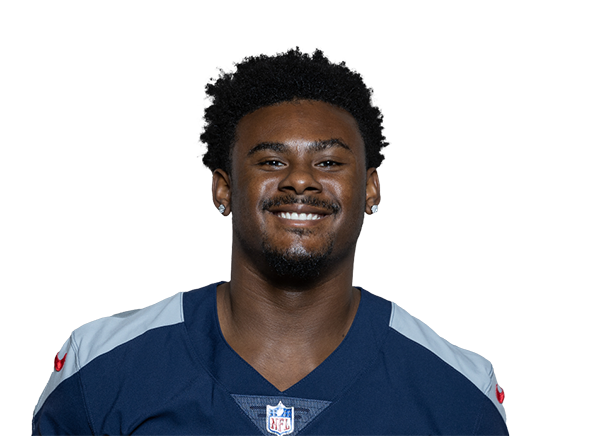 Malik WillisMIAQB Malik WillisMIAQB | 13 | 170.3 |
| 51 | 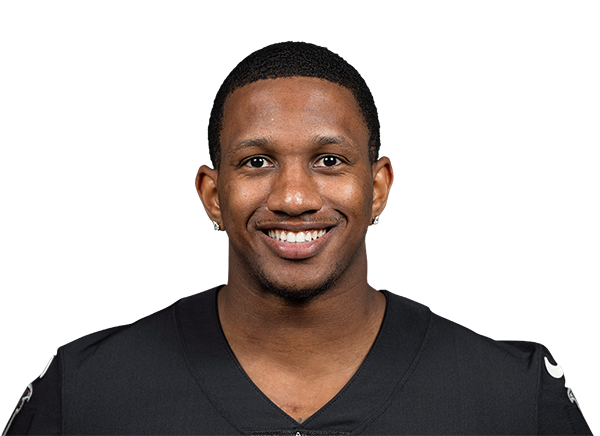 Michael Penix Jr.ATLQB Michael Penix Jr.ATLQB | 13 | 169.7 |
| 52 |  Tee HigginsCINWR Tee HigginsCINWR | 13 | 169.5 |
| 53 | 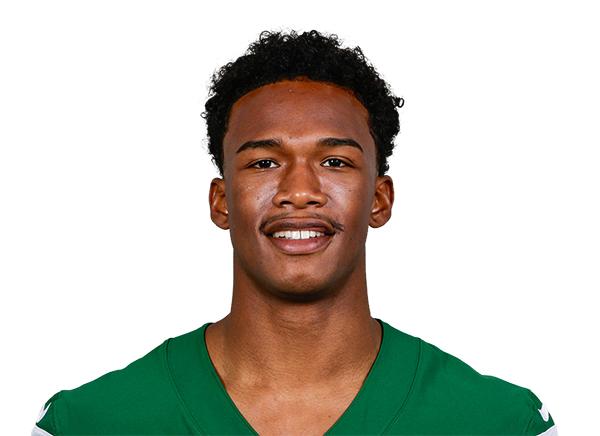 Garrett WilsonNYJWR Garrett WilsonNYJWR | 13 | 163.6 |
| 54 | 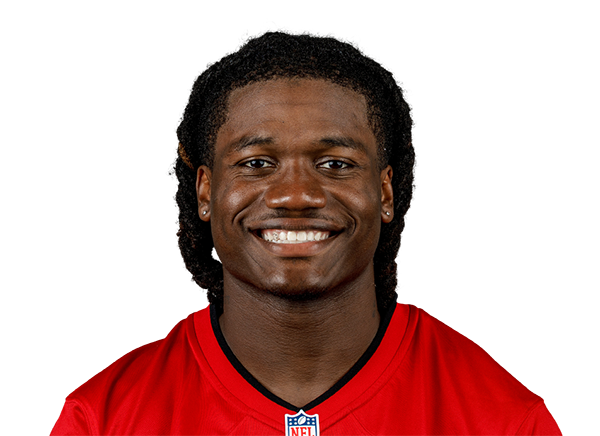 Bucky IrvingTBRB Bucky IrvingTBRB | 13 | 161.5 |
| 55 |  Trey McBrideARITE Trey McBrideARITE | 13 | 160.4 |
| 56 |  Ja'Marr ChaseCINWR Ja'Marr ChaseCINWR | 13 | 160.4 |
| 57 | 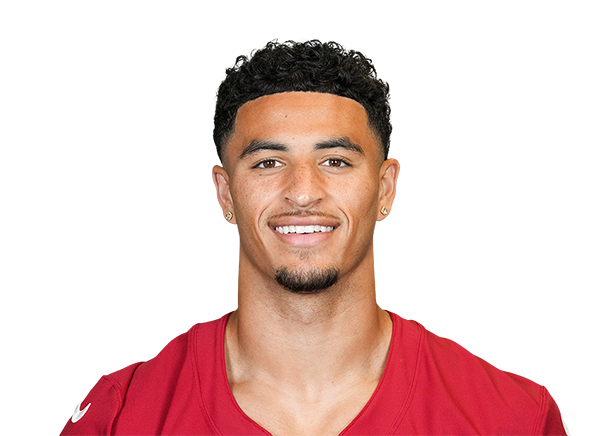 Michael WilsonARIWR Michael WilsonARIWR | 13 | 160.0 |
| 58 |  Nico CollinsHOUWR Nico CollinsHOUWR | 13 | 159.1 |
| 59 |  Tony PollardTENRB Tony PollardTENRB | 13 | 154.8 |
| 60 | 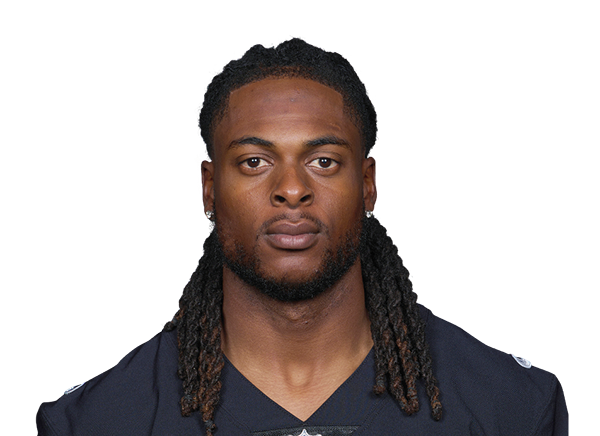 Davante AdamsLARWR Davante AdamsLARWR | 13 | 152.8 |
Deciding between two players? Who Should I Start compares them with a verdict and the reasons.
How this works
Projections are if he plays: a mean and an 80% range (p10 to p90) from 2,000 simulated games, scored in every format. Play is the chance he suits up; rankings use expected points (play chance × projection). Team volume comes from pace, pass rate and the Vegas implied total; each player's share from his recent snap, target, carry and red-zone usage, shrunk toward his role.
Matchup is opponent-adjusted defense vs position (rank 1 = toughest). It barely predicts next week early in the season, so the model gives it almost no weight and the chip is muted with a “?” when its reliability is low.
Sources: nflverse play-by-play, snaps and schedules, closing and live betting linesUpdated Tue, Oct 6, 2:39 PM ETFull methodology
Frequently asked questions
How are these fantasy football projections made?
Each player-week is team volume × his share of it × his efficiency. Team targets, carries and touchdowns come from pace, pass rate and the Vegas line; shares come from recent snap, target, carry and red-zone usage, shrunk toward role averages; efficiency is shrunk hard toward position means. We then simulate the game 2,000 times and score every simulation in each format.
What do floor and ceiling mean here?
Floor is the 10th percentile and ceiling the 90th percentile of the simulated games: in about 8 of 10 weeks a player should land between them. The tick on the bar is the median. On our 2025 holdout, 77–84% of outcomes for players projected at 8+ PPR points landed inside that range.
Why are some projections higher than the expected points?
Projected points assume he plays. The Play column is the chance he suits up, from the injury report and missed-game history, and rankings use expected points (chance to play × projection). Players ruled out, on injured reserve or on bye are not listed for the week.
How accurate are the projections?
On the 2025 holdout season (each week projected only from earlier games), PPR mean absolute error was 6.3 points at QB, 4.22 at RB, 4.29 at WR and 2.94 at TE, better than season-average and last-three-game baselines at every position. Full tables are on the methodology page.
When do the projections update?
Daily from Tuesday to Sunday morning: injury reports land Wednesday to Friday and lines move all week. A Tuesday projection has no injury report yet, so availability is less certain early in the week.