
2026 season · Week 6 to 17
Trade Value Chart & Analyzer
What every player is worth for the rest of the season in your scoring, league size and lineup, and what a trade really does to both lineups. Two-for-ones are judged on who actually starts and who gets cut, not on adding up values.
12-team PPR, 1QB · 2RB · 2WR · TE · FLEX, 6 bench. Replacement level: QB 9.0, RB 5.5, WR 5.9, TE 5.2 points a week.
Trade analyzer
Two average teams in your league format: up to four players a side.
You give
Nobody yet.
You get
Nobody yet.
Add at least one player to each side.
Rest-of-season trade value chart
Value = rest-of-season points over the best player on waivers at his position, for these league settings.
| # | Player | Value | Pts/wk | Range | So far | Actions |
|---|---|---|---|---|---|---|
| 1 | 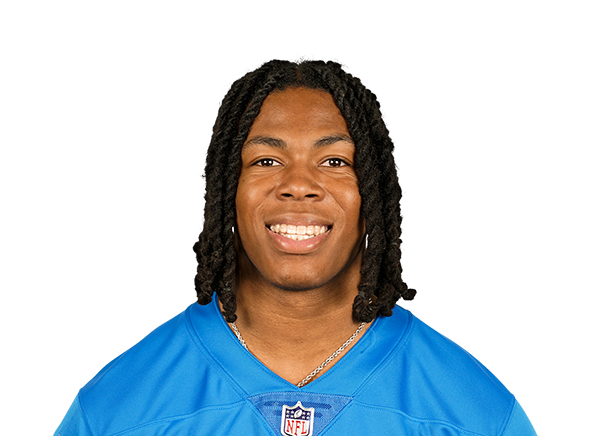 Jahmyr GibbsSell high RB1 DET | 190 | 21.3 | 17.3–25.3 | 30.7 | |
| 2 |  RB2 ATL | 182 | 20.7 | 16.7–24.7 | 24.2 | |
| 3 |  Kenneth Walker IIISell high RB3 KC | 171 | 19.8 | 15.9–23.6 | 27.5 | |
| 4 |  RB4 PIT | 151 | 18.1 | 14.5–21.8 | 18.6 | |
| 5 |  WR1 CAR | 150 | 18.5 | 14.7–22.3 | 18.6 | |
| 6 |  RB5 SF | 149 | 17.9 | 14.3–21.5 | 18.3 | |
| 7 |  Jaxon Smith-NjigbaSell high WR2 SEA | 143 | 17.8 | 14.0–21.7 | 27.9 | |
| 8 |  Puka NacuaSell high WR3 LAR | 142 | 17.8 | 14.1–21.5 | 25.9 | |
| 9 | 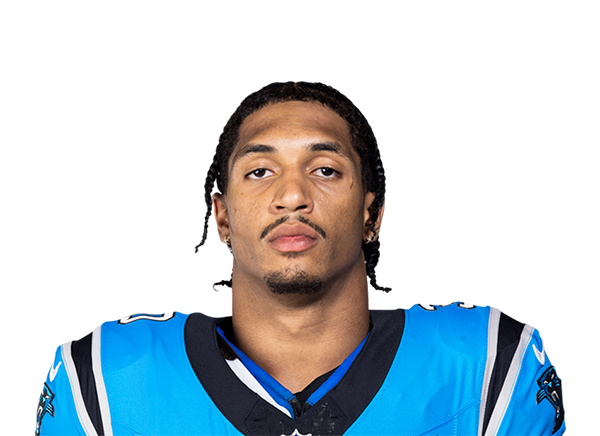 RB6 CAR | 137 | 16.9 | 13.5–20.3 | 19.8 | |
| 10 |  RB7 BAL | 133 | 16.6 | 13.1–20.1 | 22.4 | |
| 11 |  RB8 MIN | 131 | 16.4 | 13.0–19.9 | 14.0 | |
| 12 |  WR4 BAL | 128 | 16.6 | 13.0–20.2 | 20.5 | |
| 13 |  WR5 NO | 126 | 16.4 | 13.0–19.9 | 19.7 | |
| 14 |  WR6 DET | 123 | 16.2 | 12.8–19.6 | 20.8 | |
| 15 |  RB9 IND | 122 | 15.7 | 12.3–19.0 | 19.5 | |
| 16 |  RB10 CHI | 121 | 15.6 | 12.3–18.9 | 16.2 | |
| 17 |  Kyren WilliamsSell high RB11 LAR | 121 | 15.6 | 12.3–18.9 | 21.9 | |
| 18 |  RB12 BUF | 121 | 15.6 | 12.2–18.9 | 17.9 | |
| 19 |  WR7 CIN | 116 | 15.6 | 12.3–18.9 | 16.0 | |
| 20 | 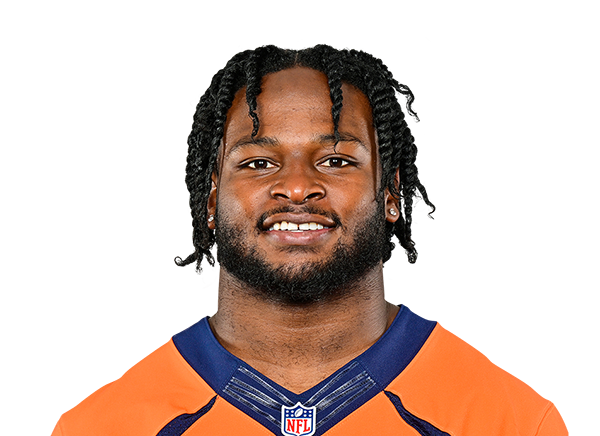 RB13 DAL | 113 | 15.0 | 11.8–18.1 | 19.2 | |
| 21 |  TE1 ARI | 111 | 14.5 | 11.2–17.7 | 18.2 | |
| 22 |  WR8 MIN | 111 | 15.2 | 11.9–18.5 | 15.9 | |
| 23 |  RB14 CIN | 111 | 14.8 | 11.7–17.9 | 13.0 | |
| 24 | 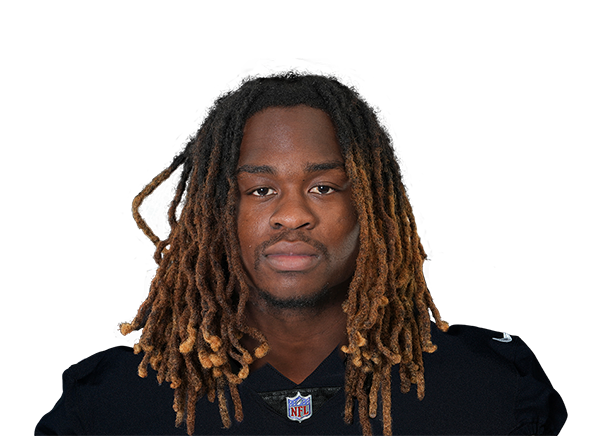 RB15 LV | 110 | 14.7 | 11.5–17.8 | 16.9 | |
| 25 |  WR9 NYJ | 102 | 14.5 | 11.4–17.6 | 17.3 | |
| 26 |  CeeDee LambSell high WR10 DAL | 102 | 14.5 | 11.1–17.8 | 23.0 | |
| 27 |  WR11 NYG | 99 | 14.2 | 11.0–17.4 | 14.8 | |
| 28 |  RB16 TB | 98 | 13.7 | 10.7–16.7 | 15.7 | |
| 29 |  Brock BowersSell high TE2 LV | 98 | 13.4 | 10.2–16.5 | 23.7 | |
| 30 |  WR12 ATL | 98 | 14.1 | 11.0–17.2 | 15.2 | |
| 31 |  Josh AllenSell high QB1 BUF | 96 | 17.1 | 14.0–20.1 | 28.6 | |
| 32 |  Nico CollinsSell high WR13 HOU | 94 | 13.7 | 10.7–16.8 | 20.9 | |
| 33 |  WR14 CIN | 93 | 13.7 | 10.7–16.8 | 15.1 | |
| 34 |  WR15 SF | 93 | 13.7 | 10.6–16.8 | 15.3 | |
| 35 |  RB17 CLE | 93 | 13.2 | 10.3–16.2 | 11.3 | |
| 36 |  RB18 NE | 92 | 13.1 | 10.3–16.0 | 12.2 | |
| 37 |  DK MetcalfBuy low WR16 PIT | 91 | 13.5 | 10.5–16.5 | 9.7 | |
| 38 | 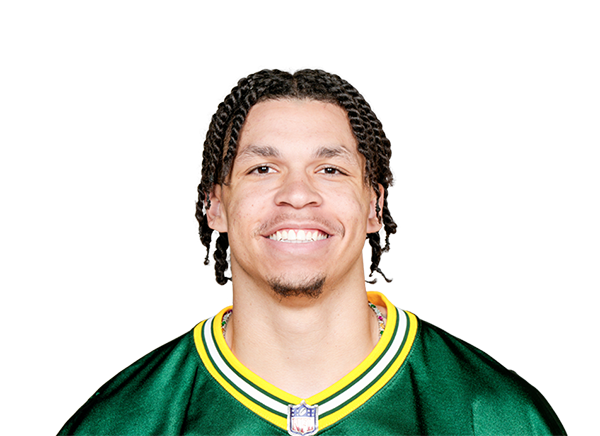 Christian WatsonSell high WR17 GB | 90 | 13.5 | 10.3–16.6 | 21.9 | |
| 39 | 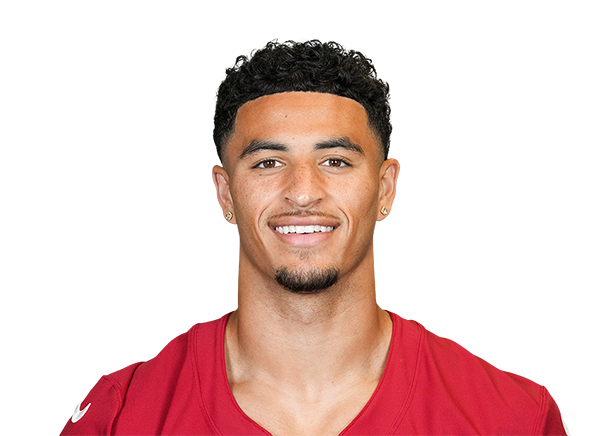 WR18 ARI | 88 | 13.3 | 10.3–16.3 | 12.8 | |
| 40 |  QB2 WAS | 88 | 16.3 | 13.4–19.3 | 21.6 | |
| 41 |  WR19 DAL | 87 | 13.2 | 10.2–16.3 | 13.7 | |
| 42 |  QB3 NE | 84 | 16.0 | 13.0–19.0 | 17.4 | |
| 43 |  Brock PurdySell high QB4 SF | 83 | 16.0 | 13.0–18.9 | 23.3 | |
| 44 |  QB5 CIN | 83 | 16.0 | 13.1–18.8 | 20.2 | |
| 45 | 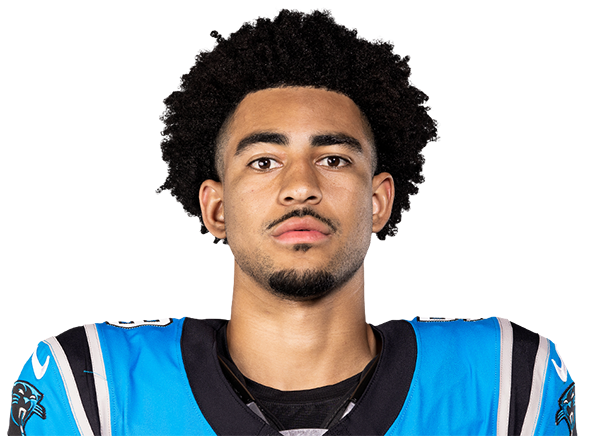 Bryce YoungSell high QB6 CAR | 83 | 15.9 | 13.0–18.8 | 22.7 | |
| 46 |  QB7 LAR | 80 | 15.7 | 12.8–18.5 | 17.8 | |
| 47 |  Patrick MahomesSell high QB8 KC | 79 | 15.6 | 12.8–18.4 | 20.9 | |
| 48 | 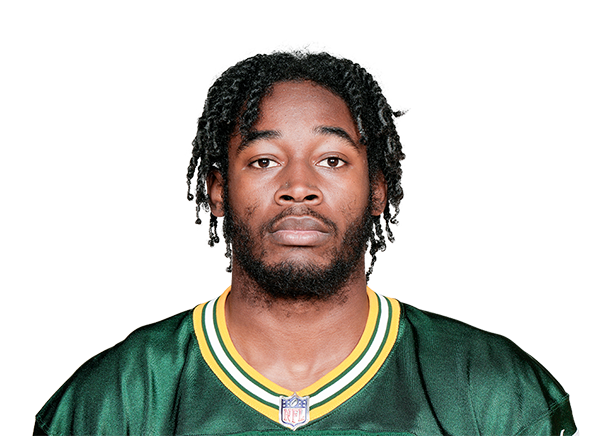 Romeo DoubsBuy low WR20 NE | 76 | 12.3 | 9.3–15.3 | 9.4 | |
| 49 |  Isaiah LikelySell high TE3 NYG | 76 | 11.5 | 8.7–14.3 | 17.1 | |
| 50 |  QB9 CLE | 75 | 15.3 | 12.5–18.0 | 15.8 | |
| 51 |  Tony PollardBuy low RB19 TEN | 75 | 11.7 | 9.1–14.3 | 8.7 | |
| 52 |  WR21 JAX | 74 | 12.1 | 9.3–15.0 | 16.3 | |
| 53 |  QB10 DAL | 74 | 15.2 | 12.4–18.0 | 18.8 | |
| 54 |  Xavier WorthyBuy low WR22 KC | 73 | 12.1 | 9.4–14.8 | 8.3 | |
| 55 |  TE4 SF | 73 | 11.3 | 8.5–14.0 | 14.4 | |
| 56 |  Davante AdamsSell high WR23 LAR | 72 | 11.9 | 9.1–14.8 | 19.0 | |
| 57 |  RB20 PHI | 72 | 11.5 | 8.8–14.2 | 3.2 | |
| 58 |  WR24 KC | 71 | 11.8 | 9.1–14.6 | 9.5 | |
| 59 |  QB11 NO | 70 | 14.9 | 12.1–17.7 | 17.0 | |
| 60 |  Jared GoffSell high QB12 DET | 70 | 14.9 | 12.1–17.6 | 23.0 | |
| 61 |  WR25 GB | 70 | 11.7 | 8.9–14.6 | 15.7 | |
| 62 |  WR26 WAS | 68 | 11.6 | 8.8–14.4 | 10.6 | |
| 63 |  QB13 JAX | 67 | 14.6 | 11.8–17.4 | 17.4 | |
| 64 |  QB14 ARI | 66 | 14.6 | 11.9–17.3 | 16.9 | |
| 65 |  WR27 CLE | 66 | 11.4 | 8.7–14.2 | 13.8 | |
| 66 |  QB15 GB | 66 | 14.5 | 11.7–17.3 | 18.0 | |
| 67 |  QB16 PHI | 65 | 14.5 | 11.7–17.2 | 16.0 | |
| 68 |  QB17 HOU | 65 | 14.4 | 11.8–17.1 | 17.8 | |
| 69 |  WR28 LV | 65 | 11.3 | 8.7–14.0 | 10.4 | |
| 70 |  WR29 MIA | 63 | 11.2 | 8.6–13.8 | 10.0 | |
| 71 |  RB21 NYG | 62 | 10.7 | 8.2–13.1 | 10.3 | |
| 72 |  Travis KelceSell high TE5 KC | 60 | 10.2 | 7.7–12.7 | 13.2 | |
| 73 |  Sam LaPortaSell high TE6 DET | 60 | 10.2 | 7.6–12.8 | 15.3 | |
| 74 |  QB18 DEN | 59 | 14.0 | 11.3–16.7 | 13.0 | |
| 75 |  QB19 PIT | 59 | 13.9 | 11.2–16.6 | 16.6 | |
| 76 |  Kyler MurrayBuy low QB20 MIN | 58 | 13.9 | 11.3–16.5 | 9.9 | |
| 77 |  RB22 HOU | 58 | 10.4 | 7.9–12.9 | 8.7 | |
| 78 |  QB21 LV | 58 | 13.9 | 11.2–16.6 | 18.5 | |
| 79 |  QB22 NYG | 58 | 13.9 | 11.2–16.6 | 13.1 | |
| 80 |  WR30 IND | 58 | 10.8 | 8.2–13.3 | 9.0 | |
| 81 |  Tyler WarrenSell high TE7 IND | 57 | 9.9 | 7.5–12.4 | 14.0 | |
| 82 |  QB23 SEA | 57 | 13.8 | 11.1–16.4 | 12.5 | |
| 83 |  Justin HerbertBuy low QB24 LAC | 56 | 13.7 | 11.1–16.3 | 10.7 | |
| 84 |  WR31 DET | 56 | 10.6 | 8.1–13.2 | 11.5 | |
| 85 |  TE8 PHI | 56 | 9.9 | 7.3–12.4 | 11.6 | |
| 86 |  WR32 TEN | 55 | 10.5 | 8.0–13.0 | 9.7 | |
| 87 |  WR33 TB | 54 | 10.5 | 7.9–13.0 | 10.7 | |
| 88 |  TE9 MIN | 54 | 9.7 | 7.3–12.1 | 9.8 | |
| 89 |  RB23 NYJ | 54 | 10.0 | 7.6–12.4 | 8.9 | |
| 90 |  WR34 DEN | 52 | 10.3 | 7.7–12.9 | 9.7 | |
| 91 |  QB25 MIA | 51 | 13.3 | 10.8–15.8 | 12.1 | |
| 92 |  RB24 JAX | 51 | 9.8 | 7.0–12.6 | 12.7 | |
| 93 |  Juwan JohnsonSell high TE10 NO | 51 | 9.4 | 7.0–11.8 | 13.2 | |
| 94 |  TE11 BAL | 51 | 9.4 | 6.9–11.9 | 8.7 | |
| 95 |  WR35 CHI | 50 | 10.1 | 7.6–12.7 | 8.5 | |
| 96 |  TE12 GB | 49 | 9.3 | 6.9–11.7 | 9.5 | |
| 97 |  WR36 PHI | 49 | 10.0 | 7.5–12.5 | 9.8 | |
| 98 |  RB25 DEN | 49 | 9.6 | 6.9–12.3 | 9.7 | |
| 99 |  RB26 NO | 49 | 9.6 | 6.9–12.2 | 9.4 | |
| 100 |  RB27 SEA | 47 | 9.4 | 6.7–12.0 | 10.2 |
How trade value works
Rest-of-season points. Our projection model runs every remaining week through week 17. Each week counts the chance he plays, and bye weeks count as zero. Pts/wk is that total spread over the weeks left. Range is the 10th to 90th percentile of the total.
Value. Rest-of-season points above replacement. We fill every team’s starters, flex and bench from the projections for your league size and lineup, and replacement is the average of the three best players left at each position. 100 on the index is the most valuable player in that format.
Trades. We don’t just add up the values. We solve each team’s best lineup before and after the trade, flex and superflex included. A small bench-cover credit counts depth for byes and injuries. Roster limits are enforced: the side receiving more players cuts its least useful bench player, and the side receiving fewer picks up the best free agent. That is the 2-for-1 penalty, worked out from your league rather than guessed. Free-agent upgrades a team can make anyway are applied before and after, so a trade never gets credit for them.
Flat value vs value to a team. The chart value is the same for everyone, like a market price. In a synced league we also show what a player is worth to a specific roster: To you is how many rest-of-season lineup points he adds to your team, To owner what his team would lose without him. A fourth running back on an RB-deep roster can have a big chart value and almost no value to his owner. We tag him a spare part, and the best targets are players worth more to you than to the team that has them.
Limits. Kickers and defenses are left out (stream them). Lineups are solved on weekly averages, not week by week, so stacked bye weeks are only roughly reflected. We don’t value dynasty futures or draft picks. In a synced league, scoring rules we don’t project (first downs, IDP, big-play bonuses) are listed and left out.
Want trades from your own league? Open the trade finder.
Sources: Edgehalla projection model, nflverse (FTN Data via nflverse)Updated Oct 14, 10:01 AM EDT
Frequently asked questions
How is rest-of-season trade value calculated?
Each player’s value is his projected points from this week through week 17 above the best player you could pick up at his position. Projections come from our own model (usage, team volume, Vegas lines and matchups, with injury and bye weeks built in). The replacement level depends on your league: a 10-team waiver wire is deep, so only stars carry much value; in 14 or 16 teams a steady RB2 does too.
Why does the analyzer disagree with the chart on 2-for-1 trades?
The chart adds values; the analyzer plays out both lineups. Two RB2s only help if both beat the players they push out, and the team getting them has to cut someone to make room. The team getting the stud fills the open spot from waivers, which is cheap in small leagues and costly in big ones. So consolidating usually wins in 8–10 team leagues, and depth deals can make sense at 12–16 teams.
Does it work with my league’s scoring?
Pick PPR, half PPR or standard, TE premium, league size, lineup (3 WR, 2 flex, superflex) and bench size, and every value updates. Connect a Sleeper league and it uses your exact scoring, lineup, rosters and free agents.
Can it find trades in my league?
Yes, for Sleeper leagues. The trade finder checks every 1-for-1, 2-for-1, 1-for-2 and 2-for-2 between your top players and each team’s, and keeps the ones that improve your lineup and theirs, with the reasons: which of their position groups is weak, who would start where, and who gets cut.
What do the Buy low and Sell high tags mean?
His points per game so far are at least 25% below (buy low) or above (sell high) our forecast for the rest of the season, after three or more games. Beating expectations barely repeats week to week, so the forecast is the better guide; the tag points out where your leaguemates are likely to value him differently.