
2026 season · Week 2
NFL Snap Counts, Week 2: Snap share leaders and changes
Offensive snaps and snap share for every quarterback, running back, receiver and tight end. Snap share is the first sign of a role change: a back who jumps from 40% to 65% of snaps is getting the work before the box score shows it.
NFL Snap Counts leaderboard
More
| # | |||||
|---|---|---|---|---|---|
| 1 |  Matthew StaffordLARQB Matthew StaffordLARQB | 62 | 100% | ▲16 | 27.0 |
| 2 |  Kirk CousinsLVQB Kirk CousinsLVQB | 63 | 100% | 0 | 20.2 |
| 3 |  Geno SmithNYJQB Geno SmithNYJQB | 74 | 100% | 0 | 15.6 |
| 4 |  Carson WentzMINQB Carson WentzMINQB | 52 | 100% | ▲17 | 6.3 |
| 5 |  Dak PrescottDALQB Dak PrescottDALQB | 55 | 100% | 0 | 29.8 |
| 6 | 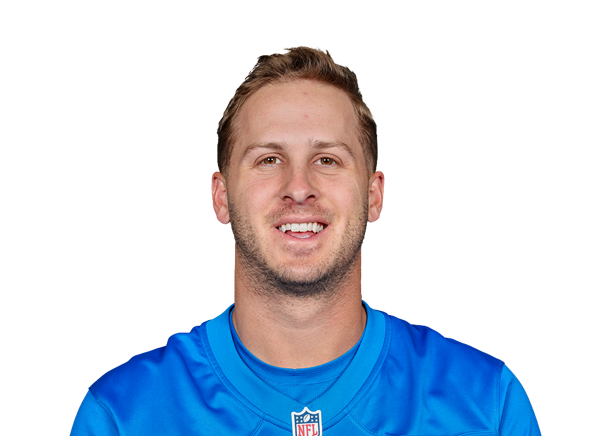 Jared GoffDETQB Jared GoffDETQB | 65 | 100% | 0 | 29.8 |
| 7 | 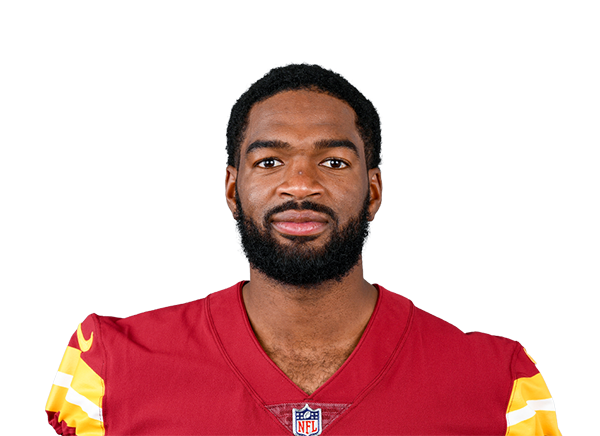 Jacoby BrissettARIQB Jacoby BrissettARIQB | 50 | 100% | 0 | 6.5 |
| 8 | 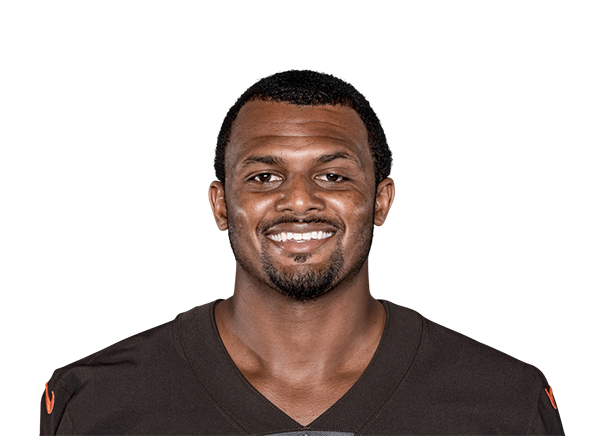 Deshaun WatsonCLEQB Deshaun WatsonCLEQB | 58 | 100% | 0 | 19.7 |
| 9 | 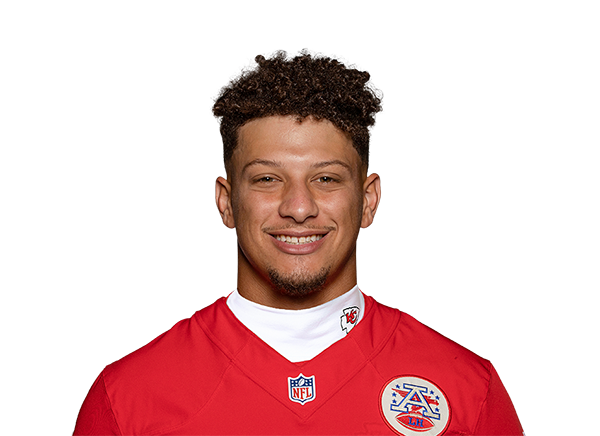 Patrick MahomesKCQB Patrick MahomesKCQB | 80 | 100% | 0 | 29.0 |
| 10 |  Lamar JacksonBALQB Lamar JacksonBALQB | 58 | 100% | +1 | 14.8 |
| 11 |  Baker MayfieldTBQB Baker MayfieldTBQB | 65 | 100% | 0 | 12.2 |
| 12 |  Josh AllenBUFQB Josh AllenBUFQB | 74 | 100% | 0 | 40.8 |
| 13 |  Drew LockSEAQB Drew LockSEAQB | 70 | 100% | +10 | 21.4 |
| 14 |  Daniel JonesINDQB Daniel JonesINDQB | 65 | 100% | 0 | 11.4 |
| 15 |  Jordan LoveGBQB Jordan LoveGBQB | 59 | 100% | 0 | 13.8 |
| 16 |  Justin JeffersonMINWR Justin JeffersonMINWR | 52 | 100% | +8 | 8.5 |
| 17 |  Justin HerbertLACQB Justin HerbertLACQB | 68 | 100% | 0 | 7.9 |
| 18 |  Joe BurrowCINQB Joe BurrowCINQB | 60 | 100% | 0 | 16.2 |
| 19 |  Trevor LawrenceJAXQB Trevor LawrenceJAXQB | 59 | 100% | ▲12 | 6.2 |
| 20 |  Malik WillisMIAQB Malik WillisMIAQB | 59 | 100% | 0 | 12.5 |
| 21 | 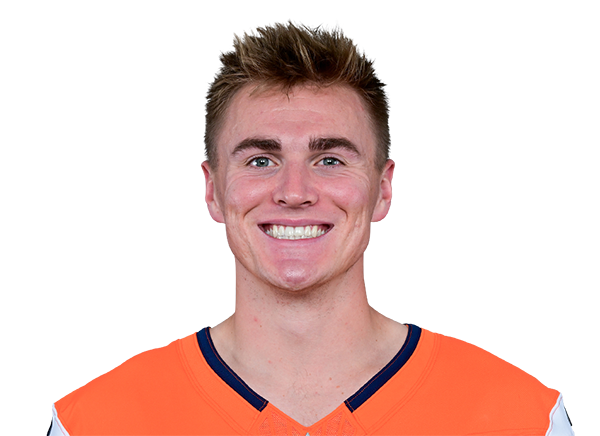 Bo NixDENQB Bo NixDENQB | 62 | 100% | 0 | 14.1 |
| 22 |  Drake MayeNEQB Drake MayeNEQB | 55 | 100% | 0 | 8.0 |
| 23 | 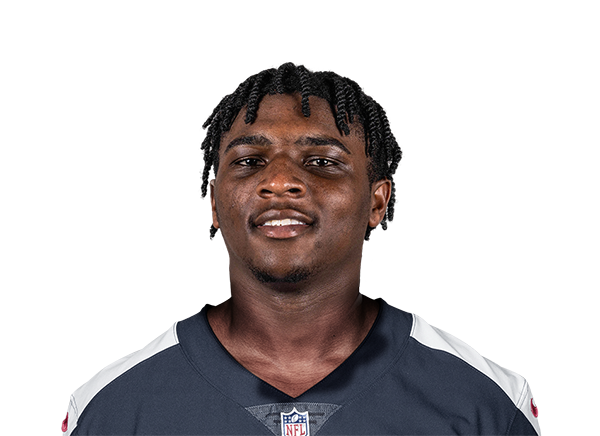 Cam WardTENQB Cam WardTENQB | 53 | 100% | 0 | 20.0 |
| 24 | 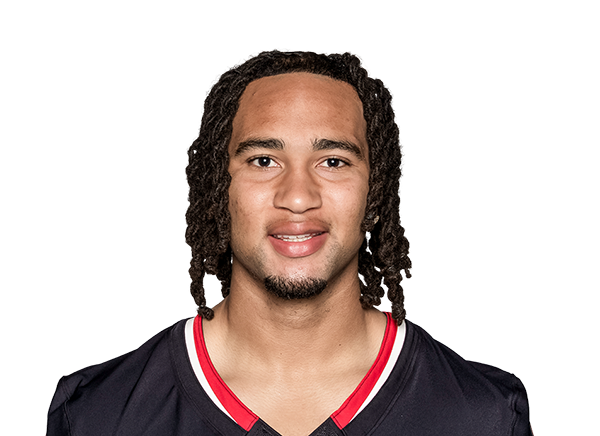 C.J. StroudHOUQB C.J. StroudHOUQB | 80 | 99% | -1 | 17.0 |
| 25 | 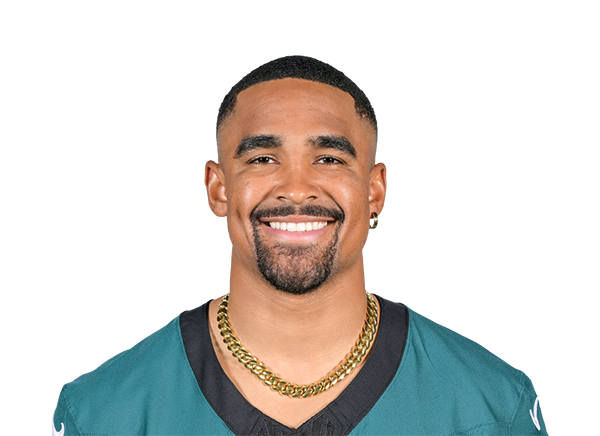 Jalen HurtsPHIQB Jalen HurtsPHIQB | 76 | 99% | -1 | 16.2 |
| 26 |  Tyler ShoughNOQB Tyler ShoughNOQB | 68 | 99% | -1 | 22.4 |
| 27 |  Sam LaPortaDETTE Sam LaPortaDETTE | 64 | 99% | ▲18 | 17.2 |
| 28 |  Tucker KraftGBTE Tucker KraftGBTE | 58 | 98% | ▲32 | 3.5 |
| 29 |  DK MetcalfPITWR DK MetcalfPITWR | 68 | 97% | +2 | 6.7 |
| 30 |  Jameson WilliamsDETWR Jameson WilliamsDETWR | 63 | 97% | ▲13 | 5.3 |
| 31 |  Aaron RodgersPITQB Aaron RodgersPITQB | 67 | 96% | -4 | 4.0 |
| 32 |  Amon-Ra St. BrownDETWR Amon-Ra St. BrownDETWR | 62 | 95% | +6 | 35.2 |
| 33 |  Devaughn VeleNOWR Devaughn VeleNOWR | 65 | 94% | +3 | 11.4 |
| 34 |  Michael WilsonARIWR Michael WilsonARIWR | 47 | 94% | +9 | 3.8 |
| 35 |  Bryce YoungCARQB Bryce YoungCARQB | 62 | 94% | +4 | 24.1 |
| 36 |  Jonathan TaylorINDRB Jonathan TaylorINDRB | 61 | 94% | +5 | 29.2 |
| 37 |  Rashod BatemanBALWR Rashod BatemanBALWR | 54 | 93% | ▲16 | 21.8 |
| 38 |  Denzel BostonCLEWR Denzel BostonCLEWR | 54 | 93% | +1 | 20.5 |
| 39 | 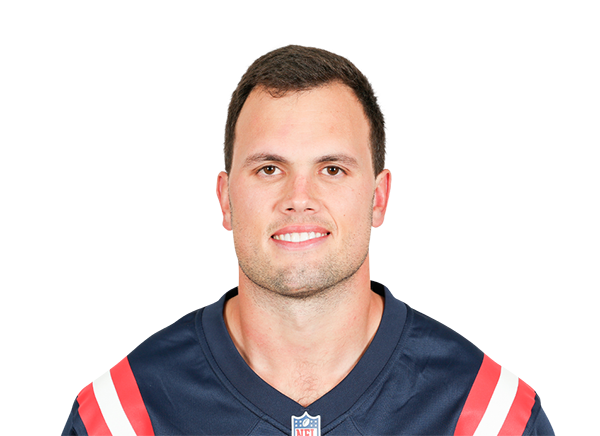 Hunter HenryNETE Hunter HenryNETE | 50 | 91% | ▲15 | 7.0 |
| 40 | 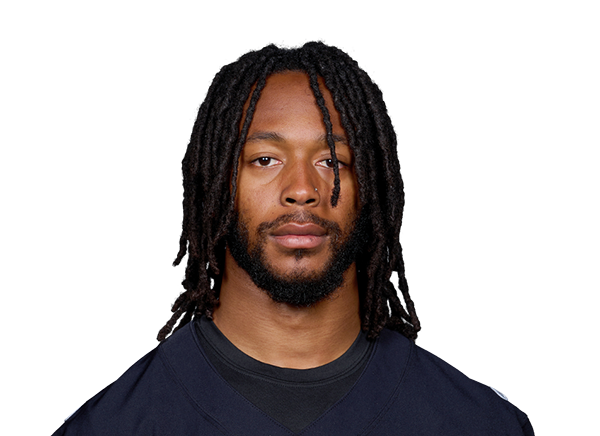 Jakobi MeyersJAXWR Jakobi MeyersJAXWR | 53 | 90% | ▲25 | 3.8 |
| 41 | 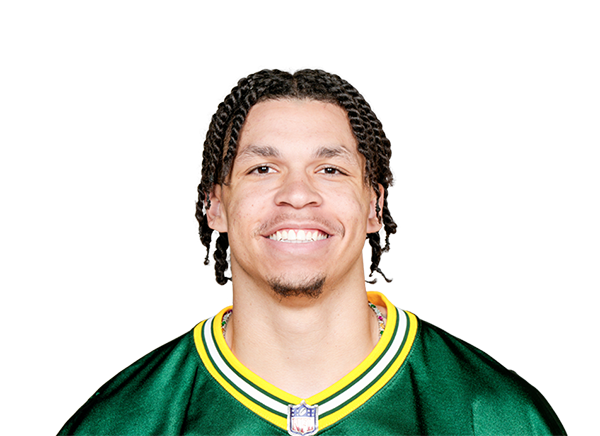 Christian WatsonGBWR Christian WatsonGBWR | 53 | 90% | ▲13 | 14.1 |
| 42 |  Cade OttonTBTE Cade OttonTBTE | 58 | 89% | -9 | 8.8 |
| 43 |  Tyler WarrenINDTE Tyler WarrenINDTE | 58 | 89% | -3 | 14.4 |
| 44 | 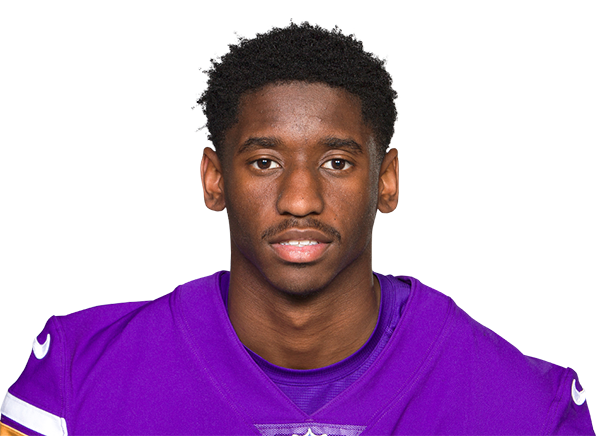 Jordan AddisonMINWR Jordan AddisonMINWR | 46 | 89% | +5 | 4.1 |
| 45 |  Ja'Marr ChaseCINWR Ja'Marr ChaseCINWR | 53 | 88% | -5 | 26.5 |
| 46 |  Trey McBrideARITE Trey McBrideARITE | 44 | 88% | +8 | 18.1 |
| 47 |  Jameis WinstonNYGQB Jameis WinstonNYGQB | 51 | 88% | – | 2.5 |
| 48 |  Garrett WilsonNYJWR Garrett WilsonNYJWR | 65 | 88% | ▲13 | 16.7 |
| 49 |  DeVonta SmithPHIWR DeVonta SmithPHIWR | 67 | 87% | -7 | 27.7 |
| 50 |  Gunnar HelmTENTE Gunnar HelmTENTE | 46 | 87% | ▲11 | 3.3 |
Top 50 of 328 players by snap %. Δ Wk compares Week 2 with each player’s previous team game; chips mark moves of 10+ points.
More usage boards: NFL Target Share · NFL Red Zone Usage · Injury report · Vegas odds
How this works
Windows end at the selected week: that week alone, the team’s last 3 games, or the season to date. Shares divide a player’s total by his team’s total over the team’s games in the window, so a missed game counts as zero (G shows games played out of team games). Team totals are summed from every player’s row for that game. Fantasy points are calculated from the stored stat lines in the format you pick (PPR by default), per game played in the multi-week windows.
Noise filter: a player is listed in a window only with 10+ offensive snaps per team game. Δ Wk is the change in snap share from the player’s previous team game; the up/down chips mark moves of 10 percentage points or more. Red zone means a play starting inside the opponent’s 20; goal line inside the 5.
Sources: nflverse play-by-play and snap countsUpdated Tue, Oct 6, 11:20 AM ET
Frequently asked questions
What is snap share?
The percentage of his team’s offensive plays a player was on the field for. It is the base of every fantasy role: a player cannot earn targets or carries from the sideline.
Why does snap share matter for fantasy football?
Snap share moves before production does. Rising snaps after an injury or depth chart change often lead to more targets and carries the following week, so it is one of the best early waiver signals.
How do you count missed games?
The last-3 and season windows divide a player’s snaps by all of his team’s snaps in those games, so a missed game counts as zero. The G column shows games played out of team games.
Why are some players missing?
Players need at least 10 offensive snaps per team game in the window to be listed, which keeps out garbage-time and special-package players.