
2026 season · Week 3
NFL Red Zone Usage, Week 3: Red-zone and goal-line touches
Who gets the ball inside the 20: red-zone targets and carries, goal-line carries (inside the 5) and each player’s share of his team’s red-zone opportunities. Touchdowns are noisy; the opportunities behind them are much more stable.
NFL Red Zone Usage leaderboard
More
| # | |||||||
|---|---|---|---|---|---|---|---|
| 1 | 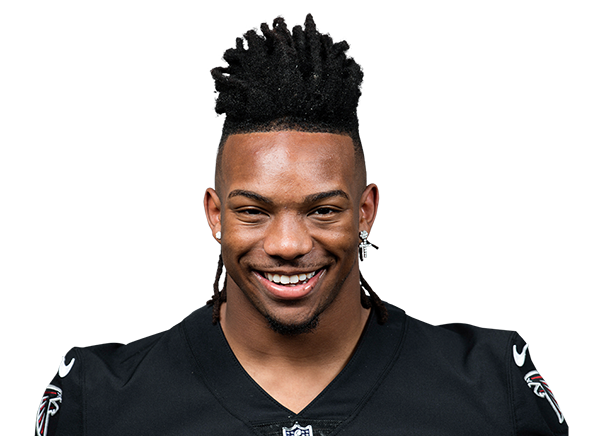 Bijan RobinsonATLRB Bijan RobinsonATLRB | 11 | 0 | 11 | 85% | – | 35.3 |
| 2 | 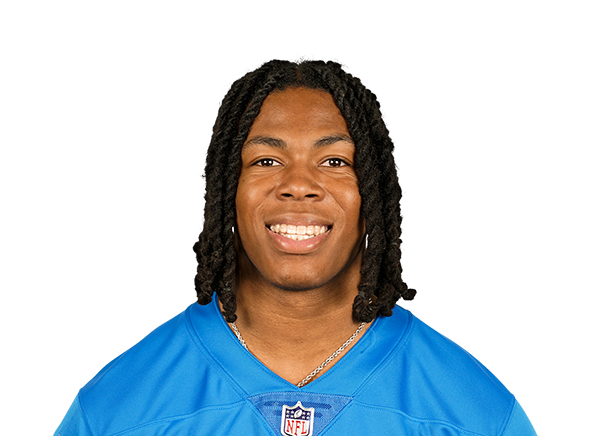 Jahmyr GibbsDETRB Jahmyr GibbsDETRB | 10 | 3 | 7 | 67% | ▲21 | 41.4 |
| 3 | 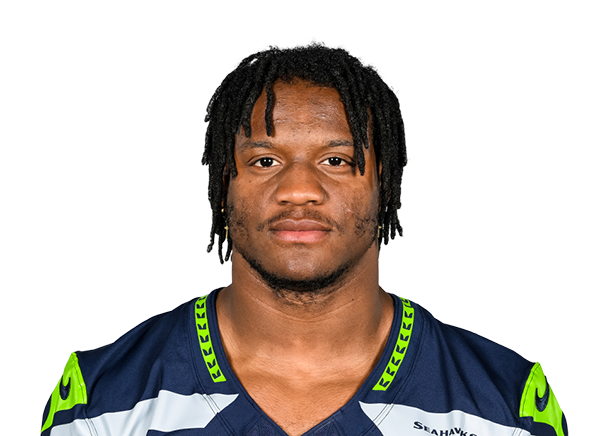 Kenneth Walker IIIKCRB Kenneth Walker IIIKCRB | 9 | 2 | 7 | 64% | ▲10 | 21.3 |
| 4 | 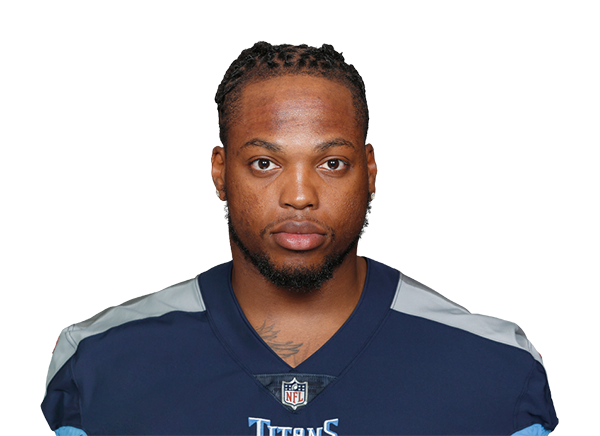 Derrick HenryBALRB Derrick HenryBALRB | 9 | 0 | 9 | 50% | ▼33 | 21.9 |
| 5 |  Ashton JeantyLVRB Ashton JeantyLVRB | 6 | 0 | 6 | 50% | -10 | 12.3 |
| 6 |  Omarion HamptonLACRB Omarion HamptonLACRB | 6 | 0 | 6 | 43% | -7 | 5.6 |
| 7 |  Jeremiyah LoveARIRB Jeremiyah LoveARIRB | 6 | 2 | 4 | 33% | -7 | 21.9 |
| 8 |  D'Andre SwiftCHIRB D'Andre SwiftCHIRB | 6 | 0 | 6 | 32% | +7 | 10.8 |
| 9 |  Javonte WilliamsDALRB Javonte WilliamsDALRB | 5 | 0 | 5 | 31% | -9 | 18.3 |
| 10 | 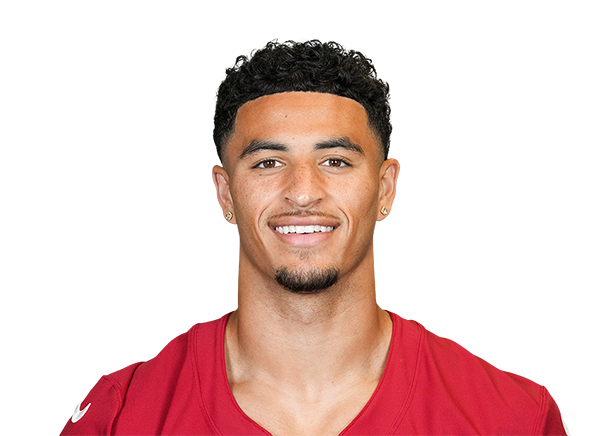 Michael WilsonARIWR Michael WilsonARIWR | 5 | 5 | 0 | 28% | ▲28 | 25.9 |
| 11 | 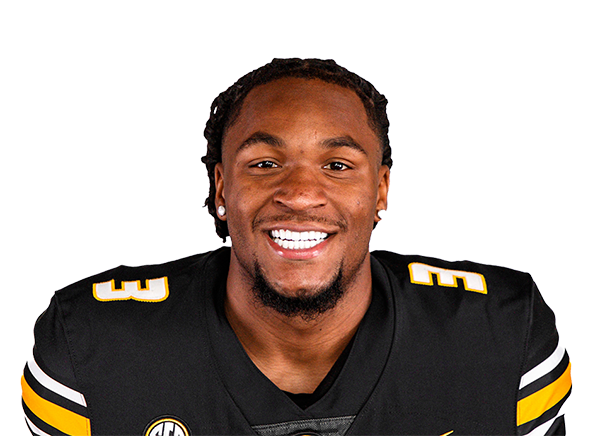 Luther Burden IIICHIWR Luther Burden IIICHIWR | 5 | 4 | 1 | 26% | +10 | 19.8 |
| 12 |  Cam SkatteboNYGRB Cam SkatteboNYGRB | 4 | 0 | 4 | 67% | ▲42 | 13.0 |
| 13 | 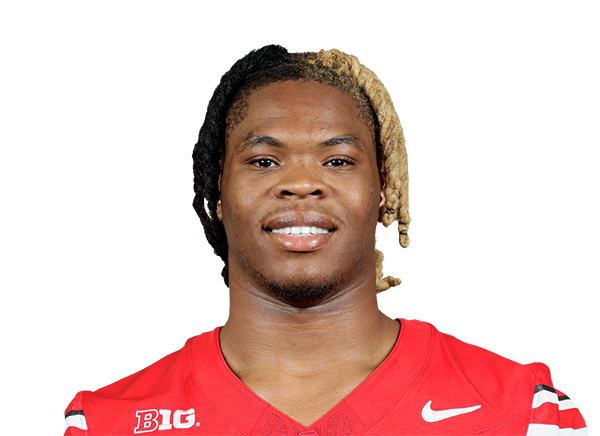 Quinshon JudkinsCLERB Quinshon JudkinsCLERB | 4 | 1 | 3 | 40% | ▲20 | 9.9 |
| 14 |  AJ BarnerSEATE AJ BarnerSEATE | 4 | 4 | 0 | 33% | ▲29 | 11.9 |
| 15 |  Ryan FlournoyDALWR Ryan FlournoyDALWR | 4 | 4 | 0 | 25% | ▲25 | 4.2 |
| 16 |  Bhayshul TutenJAXRB Bhayshul TutenJAXRB | 4 | 0 | 4 | 25% | ▼25 | 17.0 |
| 17 | 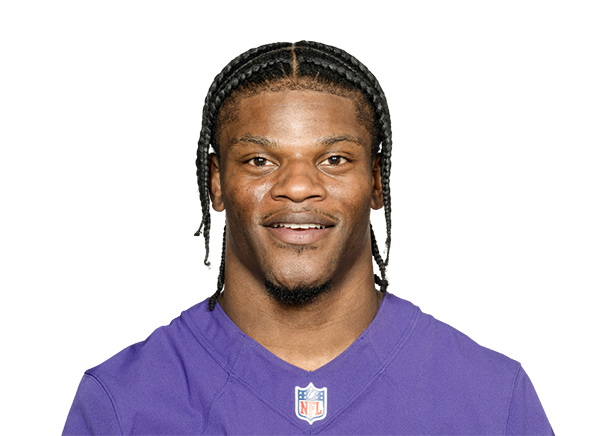 Lamar JacksonBALQB Lamar JacksonBALQB | 4 | 0 | 4 | 22% | ▲22 | 20.4 |
| 18 |  Ollie Gordon IIMIARB Ollie Gordon IIMIARB | 3 | 0 | 3 | 60% | ▲50 | 14.5 |
| 19 |  Jaylen WarrenPITRB Jaylen WarrenPITRB | 3 | 1 | 2 | 43% | ▲43 | 20.6 |
| 20 |  Breece HallNYJRB Breece HallNYJRB | 3 | 0 | 3 | 43% | ▲29 | 8.5 |
| 21 |  Braelon AllenNYJRB Braelon AllenNYJRB | 3 | 1 | 2 | 43% | ▲14 | 4.7 |
| 22 |  Jacory Croskey-MerrittWASRB Jacory Croskey-MerrittWASRB | 3 | 0 | 3 | 43% | ▲33 | 5.3 |
| 23 |  Christian McCaffreySFRB Christian McCaffreySFRB | 3 | 1 | 2 | 38% | ▼12 | 21.6 |
| 24 |  Saquon BarkleyPHIRB Saquon BarkleyPHIRB | 3 | 0 | 3 | 33% | ▲33 | 9.0 |
| 25 |  Josh AllenBUFQB Josh AllenBUFQB | 3 | 0 | 3 | 33% | +6 | 17.5 |
| 26 |  Jonathan TaylorINDRB Jonathan TaylorINDRB | 3 | 1 | 2 | 33% | ▼17 | 9.2 |
| 27 |  James CookBUFRB James CookBUFRB | 3 | 0 | 3 | 33% | ▼12 | 19.4 |
| 28 |  Deshaun WatsonCLEQB Deshaun WatsonCLEQB | 3 | 0 | 3 | 30% | ▲30 | 20.3 |
| 29 |  Mack HollinsNEWR Mack HollinsNEWR | 3 | 3 | 0 | 30% | ▲30 | 14.7 |
| 30 |  Tony PollardTENRB Tony PollardTENRB | 3 | 0 | 3 | 30% | -9 | 13.6 |
| 31 |  Wan'Dale RobinsonTENWR Wan'Dale RobinsonTENWR | 3 | 3 | 0 | 30% | ▲30 | 18.7 |
| 32 |  Christian WatsonGBWR Christian WatsonGBWR | 3 | 3 | 0 | 27% | +2 | 22.6 |
| 33 |  MarShawn LloydGBRB MarShawn LloydGBRB | 3 | 0 | 3 | 27% | ▼10 | 3.8 |
| 34 |  Jaxon Smith-NjigbaSEAWR Jaxon Smith-NjigbaSEAWR | 3 | 3 | 0 | 25% | ▲11 | 35.4 |
| 35 |  Brock BowersLVTE Brock BowersLVTE | 3 | 3 | 0 | 25% | – | 27.6 |
| 36 |  Travis EtienneNORB Travis EtienneNORB | 3 | 0 | 3 | 23% | ▲23 | 9.0 |
| 37 |  Chris OlaveNOWR Chris OlaveNOWR | 3 | 3 | 0 | 23% | ▲23 | 19.7 |
| 38 |  Courtland SuttonDENWR Courtland SuttonDENWR | 3 | 3 | 0 | 21% | ▲12 | 7.6 |
| 39 |  J.K. DobbinsDENRB J.K. DobbinsDENRB | 3 | 0 | 3 | 21% | -6 | 6.3 |
| 40 |  Tre HarrisLACWR Tre HarrisLACWR | 3 | 3 | 0 | 21% | ▲21 | 13.6 |
| 41 |  Amon-Ra St. BrownDETWR Amon-Ra St. BrownDETWR | 3 | 3 | 0 | 20% | +2 | 11.9 |
| 42 |  Parker WashingtonJAXWR Parker WashingtonJAXWR | 3 | 3 | 0 | 19% | ▲19 | 13.0 |
| 43 |  Chris Rodriguez Jr.JAXRB Chris Rodriguez Jr.JAXRB | 3 | 0 | 3 | 19% | +2 | 9.7 |
| 44 |  Kyle MonangaiCHIRB Kyle MonangaiCHIRB | 3 | 0 | 3 | 16% | -9 | 3.1 |
| 45 |  Bucky IrvingTBRB Bucky IrvingTBRB | 2 | 2 | 0 | 67% | ▲42 | 7.8 |
| 46 |  Ja'Marr ChaseCINWR Ja'Marr ChaseCINWR | 2 | 2 | 0 | 50% | 0 | 24.8 |
| 47 |  Foster MoreauHOUTE Foster MoreauHOUTE | 2 | 2 | 0 | 29% | ▲29 | 8.7 |
| 48 |  Rachaad WhiteWASRB Rachaad WhiteWASRB | 2 | 1 | 1 | 29% | +9 | 11.1 |
| 49 |  Woody MarksHOURB Woody MarksHOURB | 2 | 0 | 2 | 29% | ▼21 | 9.1 |
| 50 |  George KittleSFTE George KittleSFTE | 2 | 2 | 0 | 25% | +8 | 26.2 |
Top 50 of 146 players by red-zone opportunities. Δ Wk compares Week 3 with each player’s previous team game; chips mark moves of 10+ points.
More usage boards: NFL Snap Counts · NFL Target Share · Injury report · Vegas odds
How this works
Windows end at the selected week: that week alone, the team’s last 3 games, or the season to date. Shares divide a player’s total by his team’s total over the team’s games in the window, so a missed game counts as zero (G shows games played out of team games). Team totals are summed from every player’s row for that game. Fantasy points are calculated from the stored stat lines in the format you pick (PPR by default), per game played in the multi-week windows.
Noise filter: a player is listed in a window only with 10+ offensive snaps per team game and at least one red-zone target or carry. Δ Wk is the change in red-zone share from the player’s previous team game; the up/down chips mark moves of 10 percentage points or more. Red zone means a play starting inside the opponent’s 20; goal line inside the 5.
Sources: nflverse play-by-play and snap countsUpdated Tue, Oct 6, 11:20 AM ET
Frequently asked questions
What counts as a red-zone opportunity?
A target or a carry on a play that starts inside the opponent’s 20-yard line. Goal-line carries are carries inside the 5.
What is red-zone share?
The player’s red-zone targets plus carries divided by all of his team’s red-zone targets and carries in the window.
Why use red-zone share instead of touchdowns?
Touchdowns swing a lot week to week. Players who keep getting red-zone work score more touchdowns over time, so red-zone share is a better guide to future scoring than last week’s touchdowns.
Why are some players missing?
Players need at least 10 offensive snaps per team game in the window to be listed, with at least one red-zone opportunity.