
2026 season · Week 1
NFL Target Share, Week 1: Targets and air yards leaders
Targets, target share and air-yard share for every running back, receiver and tight end. Target share is the most stable predictor of receiving production; air-yard share shows who is getting the deep, high-value looks.
NFL Target Share leaderboard
More
| # | Δ Wk | ||||
|---|---|---|---|---|---|
| 1 |  Bijan RobinsonATLRB Bijan RobinsonATLRB | 10 | 53% | – | 31.3 |
| 2 |  Jaxon Smith-NjigbaSEAWR Jaxon Smith-NjigbaSEAWR | 11 | 46% | – | 26.2 |
| 3 |  Justin JeffersonMINWR Justin JeffersonMINWR | 9 | 39% | – | 31.2 |
| 4 |  Amon-Ra St. BrownDETWR Amon-Ra St. BrownDETWR | 14 | 36% | – | 28.7 |
| 5 |  Trey McBrideARITE Trey McBrideARITE | 13 | 35% | – | 24.5 |
| 6 |  Kalif RaymondCHIWR Kalif RaymondCHIWR | 9 | 35% | – | 16.4 |
| 7 |  Puka NacuaLARWR Puka NacuaLARWR | 9 | 33% | – | 12.4 |
| 8 |  Stefon DiggsWASWR Stefon DiggsWASWR | 9 | 31% | – | 15.5 |
| 9 |  Malik NabersNYGWR Malik NabersNYGWR | 9 | 31% | – | 12.9 |
| 10 |  Garrett WilsonNYJWR Garrett WilsonNYJWR | 7 | 30% | – | 13.9 |
| 11 |  Matthew GoldenGBWR Matthew GoldenGBWR | 12 | 30% | – | 15.5 |
| 12 | 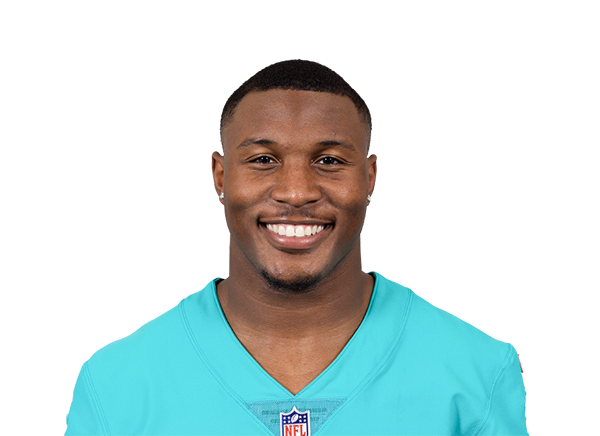 Malik WashingtonMIAWR Malik WashingtonMIAWR | 8 | 30% | – | 6.3 |
| 13 | 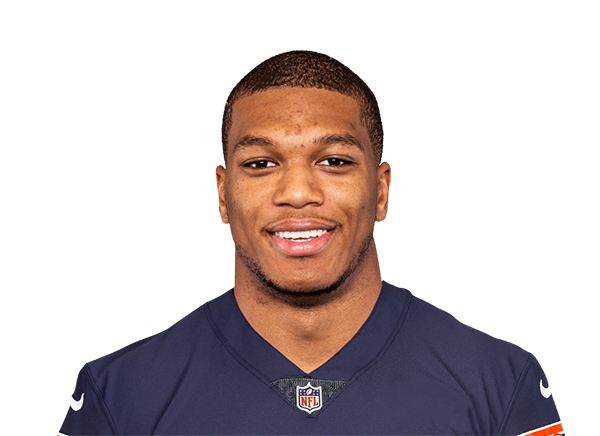 DJ MooreBUFWR DJ MooreBUFWR | 8 | 29% | – | 21.0 |
| 14 | 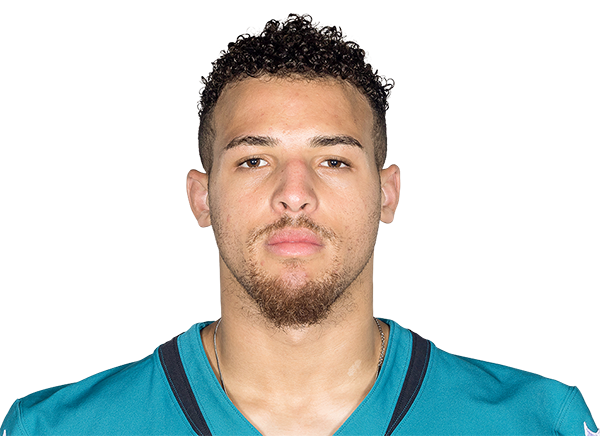 Parker WashingtonJAXWR Parker WashingtonJAXWR | 6 | 29% | – | 19.3 |
| 15 | 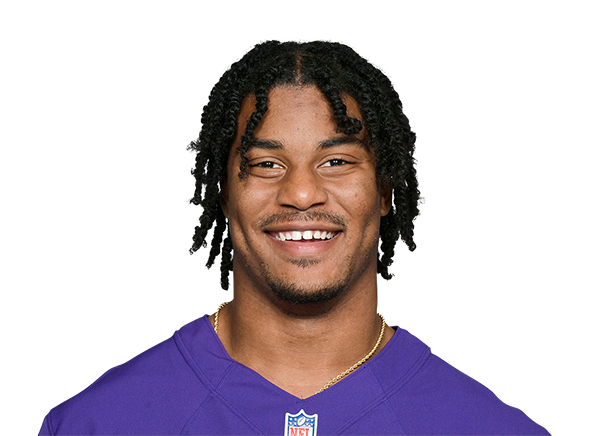 Isaiah LikelyNYGTE Isaiah LikelyNYGTE | 8 | 28% | – | 27.8 |
| 16 |  DeVonta SmithPHIWR DeVonta SmithPHIWR | 6 | 27% | – | 8.3 |
| 17 |  DK MetcalfPITWR DK MetcalfPITWR | 10 | 27% | – | 8.0 |
| 18 |  Nico CollinsHOUWR Nico CollinsHOUWR | 10 | 27% | – | 21.2 |
| 19 |  CeeDee LambDALWR CeeDee LambDALWR | 8 | 27% | – | 15.4 |
| 20 |  Jalen CokerCARWR Jalen CokerCARWR | 9 | 27% | – | 33.8 |
| 21 |  Bucky IrvingTBRB Bucky IrvingTBRB | 7 | 26% | – | 20.3 |
| 22 |  Ladd McConkeyLACWR Ladd McConkeyLACWR | 7 | 26% | – | 19.2 |
| 23 |  Caleb DouglasMIAWR Caleb DouglasMIAWR | 7 | 26% | – | 14.4 |
| 24 |  Mark AndrewsBALTE Mark AndrewsBALTE | 6 | 25% | – | 8.9 |
| 25 | 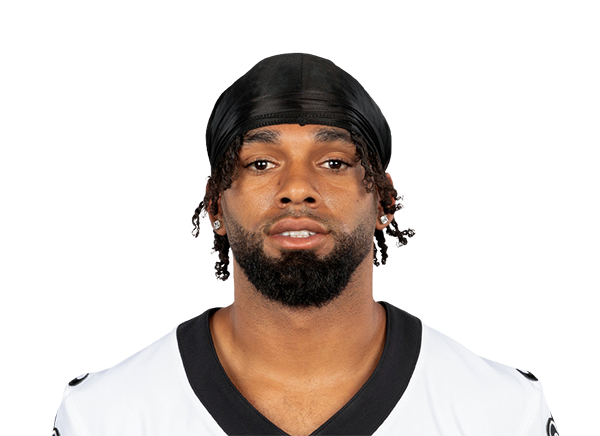 Chris OlaveNOWR Chris OlaveNOWR | 13 | 25% | – | 28.2 |
| 26 | 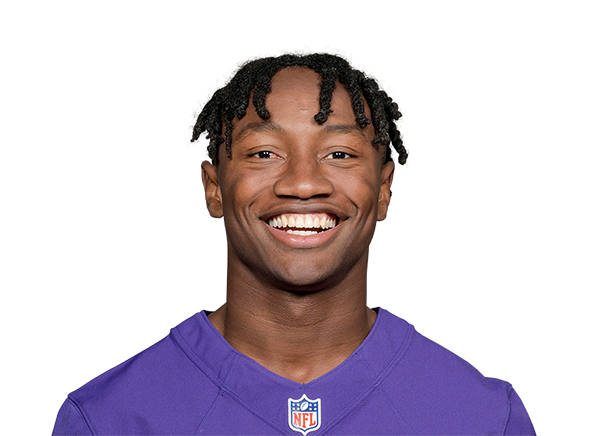 Zay FlowersBALWR Zay FlowersBALWR | 6 | 25% | – | 26.0 |
| 27 |  Michael MayerLVTE Michael MayerLVTE | 7 | 24% | – | 9.2 |
| 28 | 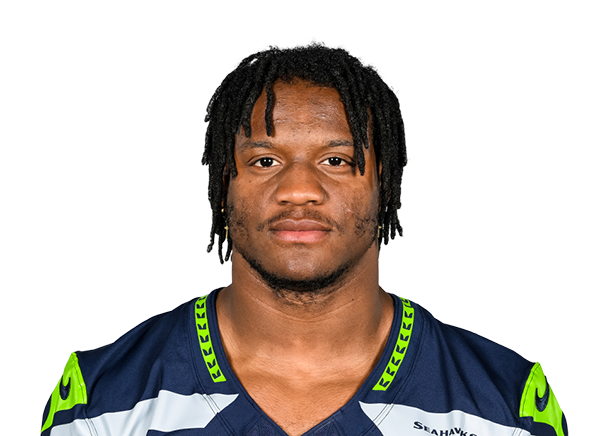 Kenneth Walker IIIKCRB Kenneth Walker IIIKCRB | 6 | 24% | – | 34.1 |
| 29 | 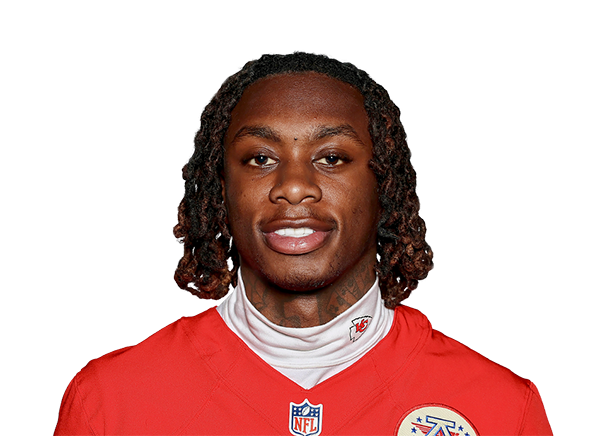 Xavier WorthyKCWR Xavier WorthyKCWR | 6 | 24% | – | 4.8 |
| 30 |  Christian McCaffreySFRB Christian McCaffreySFRB | 8 | 24% | – | 13.8 |
| 31 |  Tetairoa McMillanCARWR Tetairoa McMillanCARWR | 8 | 24% | – | 10.5 |
| 32 |  Jameson WilliamsDETWR Jameson WilliamsDETWR | 9 | 23% | – | 8.5 |
| 33 |  Dallas GoedertPHITE Dallas GoedertPHITE | 5 | 23% | – | 23.7 |
| 34 |  KC ConcepcionCLEWR KC ConcepcionCLEWR | 5 | 23% | – | 7.8 |
| 35 |  DeMario DouglasNEWR DeMario DouglasNEWR | 7 | 23% | – | 7.0 |
| 36 |  Davante AdamsLARWR Davante AdamsLARWR | 6 | 22% | – | 5.6 |
| 37 |  Quentin JohnstonLACWR Quentin JohnstonLACWR | 6 | 22% | – | 3.7 |
| 38 |  Emeka EgbukaTBWR Emeka EgbukaTBWR | 6 | 22% | – | 11.3 |
| 39 |  Pat BryantDENWR Pat BryantDENWR | 6 | 22% | – | 8.2 |
| 40 |  Tre HarrisLACWR Tre HarrisLACWR | 6 | 22% | – | 5.0 |
| 41 |  T.J. HockensonMINTE T.J. HockensonMINTE | 5 | 22% | – | 13.6 |
| 42 |  Kendrick BourneARIWR Kendrick BourneARIWR | 8 | 22% | – | 15.5 |
| 43 |  Dalton SchultzHOUTE Dalton SchultzHOUTE | 8 | 22% | – | 7.5 |
| 44 |  Khalil ShakirBUFWR Khalil ShakirBUFWR | 6 | 21% | – | 9.0 |
| 45 |  Wan'Dale RobinsonTENWR Wan'Dale RobinsonTENWR | 6 | 21% | – | 8.8 |
| 46 |  Dalton KincaidBUFTE Dalton KincaidBUFTE | 6 | 21% | – | 18.0 |
| 47 |  Carnell TateTENWR Carnell TateTENWR | 6 | 21% | – | 7.8 |
| 48 |  Drake LondonATLWR Drake LondonATLWR | 4 | 21% | – | 5.5 |
| 49 |  Keenan AllenINDWR Keenan AllenINDWR | 6 | 21% | – | 9.2 |
| 50 |  Alec PierceINDWR Alec PierceINDWR | 6 | 21% | – | 10.1 |
Top 50 of 234 players by target share. Δ Wk compares Week 1 with each player’s previous team game; chips mark moves of 5+ points.
More usage boards: NFL Snap Counts · NFL Red Zone Usage · Injury report · Vegas odds
How this works
Windows end at the selected week: that week alone, the team’s last 3 games, or the season to date. Shares divide a player’s total by his team’s total over the team’s games in the window, so a missed game counts as zero (G shows games played out of team games). Team totals are summed from every player’s row for that game. Fantasy points are calculated from the stored stat lines in the format you pick (PPR by default), per game played in the multi-week windows.
Noise filter: a player is listed in a window only with 10+ offensive snaps per team game and at least one target. Δ Wk is the change in target share from the player’s previous team game; the up/down chips mark moves of 5 percentage points or more. Red zone means a play starting inside the opponent’s 20; goal line inside the 5.
Sources: nflverse play-by-play and snap countsUpdated Tue, Oct 6, 11:20 AM ET
Frequently asked questions
What is target share?
The percentage of his team’s pass targets that went to a player. Twenty percent or more is a featured receiver; 25% and up is elite.
What is air-yard share?
The player’s share of the team’s air yards: how far downfield the passes thrown his way travelled, completed or not. High air-yard share with low production often means positive regression is coming.
Why is a quarterback not on this board?
Quarterbacks are not targeted; see the snap counts board for them.
Why are some players missing?
Players need at least 10 offensive snaps per team game in the window to be listed, with at least one target.