
2026 season · usage through Week 4
Usage Risers and Fallers: Week 4
Who gained and lost snaps, targets and carries over his team’s last two games, why (injury, depth chart, role), and whether he is worth a pickup for Week 5. This week: 118 risers, led by Tyson Bagent.
Usage risers and fallers
More snaps, targets or carries than his baseline: the role is growing.
| Verdict | ||||
|---|---|---|---|---|
 Tyson BagentCHIQBInjury opening Tyson BagentCHIQBInjury opening | Snap share8% → 100%+92 | 5.5 | 1% | With Caleb Williams out, Tyson Bagent’s snap share jumped from 8% to 100% over the last two games. |
 Athan KaliakmanisWASQBInjury opening Athan KaliakmanisWASQBInjury opening | Snap share5% → 84%+79 | 11.0 | 0% | With Jayden Daniels out, Athan Kaliakmanis’ snap share jumped from 5% to 84% over the last two games. |
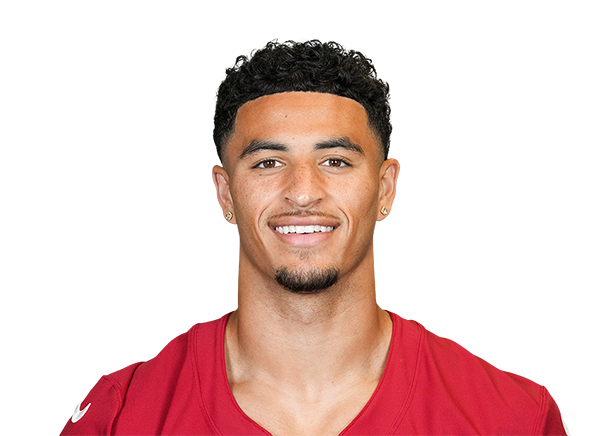 Michael WilsonARIWRRole change Michael WilsonARIWRRole change | Target share20% → 36%+16Snap share81% → 94%+13 | 21.2 | 86% | Michael Wilson’s role has grown: snap share 81% → 94% and target share 20% → 36%. |
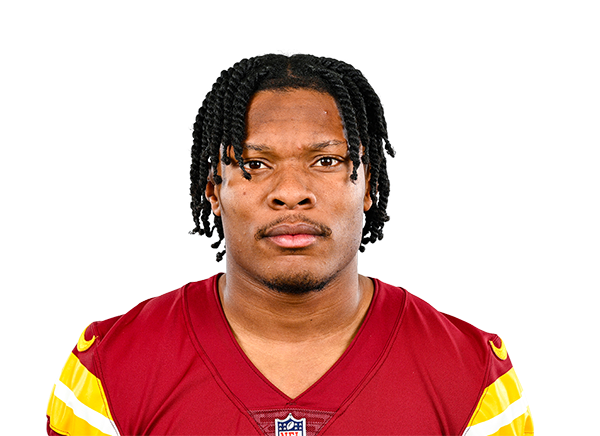 Mitchell TinsleyCINWRBack from absence Mitchell TinsleyCINWRBack from absence | Target share4% → 13%+9Snap share26% → 53%+27 | 7.9 | 0% | Mitchell Tinsley is back: 53% of snaps since returning, with no games earlier this season. |
 Jalon DanielsTBQBRole change Jalon DanielsTBQBRole change | Snap share5% → 53%+48 | 5.2 | 2% | Jalon Daniels’ role has grown: snap share 5% → 53%. |
 Kyren WilliamsLARRBRole change Kyren WilliamsLARRBRole change | Carry share48% → 65%+16Snap share62% → 77%+15 | 29.3 | 99% | The LAR staff is using Kyren Williams more: 77% of snaps over the last two games against 62% before. |
 Aaron JonesMINRBInjury opening Aaron JonesMINRBInjury opening | Carry share47% → 69%+22Snap share55% → 77%+22 | 15.5 | 93% | Jordan Mason’s injury left 44% of the MIN carries up for grabs, and Aaron Jones has absorbed 50% of it (carry share 47% → 69%). |
 Case KeenumCHIQBInjury opening Case KeenumCHIQBInjury opening | Snap share5% → 51%+46 | 12.3 | 3% | Caleb Williams’ injury left 0% of the CHI snaps up for grabs, and Case Keenum has absorbed 46% of it (snap share 5% → 51%). |
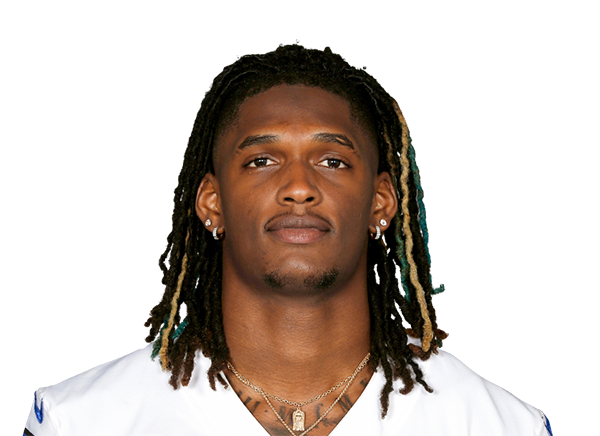 CeeDee LambDALWRRole change CeeDee LambDALWRRole change | Target share23% → 34%+11Snap share71% → 84%+13 | 30.8 | 100% | CeeDee Lamb’s role has grown: snap share 71% → 84% and target share 23% → 34%. |
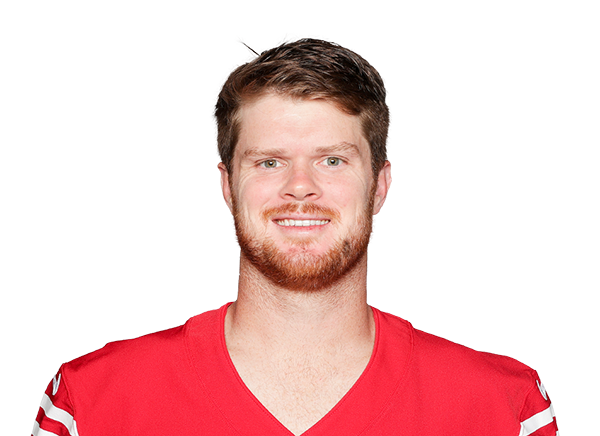 Sam DarnoldSEAQBDepth chart promotion Sam DarnoldSEAQBDepth chart promotion | Snap share71% → 100%+29 | 20.5 | 53% | Sam Darnold has moved up the SEA depth chart past Drew Lock and played 100% of snaps over the last two games, up from 71%. |
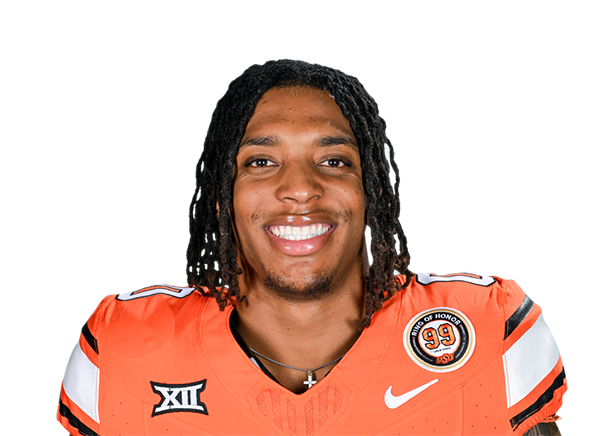 Ollie Gordon IIMIARBInjury opening Ollie Gordon IIMIARBInjury opening | Carry share12% → 52%+40Snap share19% → 70%+51 | 16.3 | 62% | De'Von Achane’s injury left 66% of the MIA carries up for grabs, and Ollie Gordon II has absorbed 61% of it (carry share 12% → 52%). |
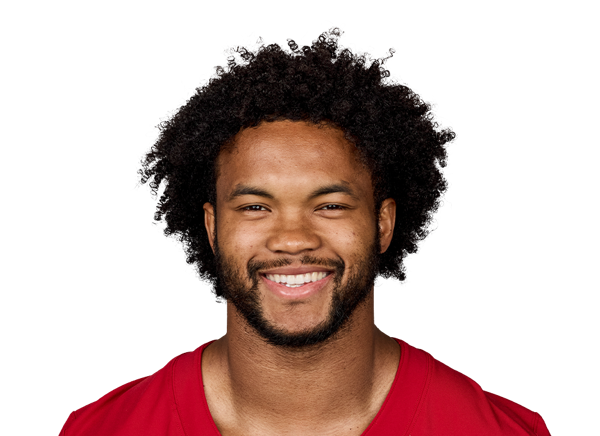 Kyler MurrayMINQBDepth chart promotion Kyler MurrayMINQBDepth chart promotion | Snap share61% → 100%+39 | 10.9 | 65% | MIN now lists Kyler Murray as a starter ahead of Carson Wentz; snap share 61% → 100%. |
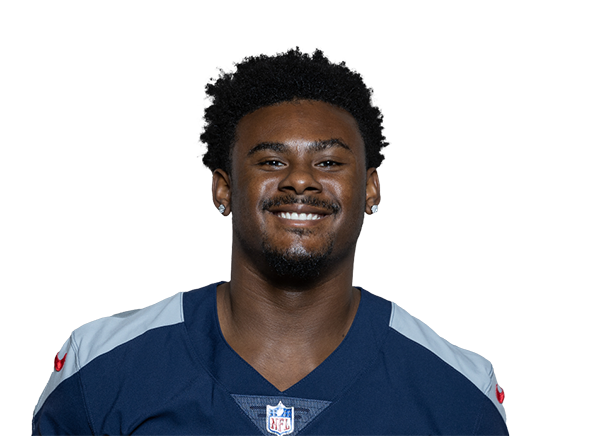 Malik WillisMIAQBRole change Malik WillisMIAQBRole change | Snap share53% → 100%+47 | 6.3 | 11% | Malik Willis’ role has grown: snap share 53% → 100%. |
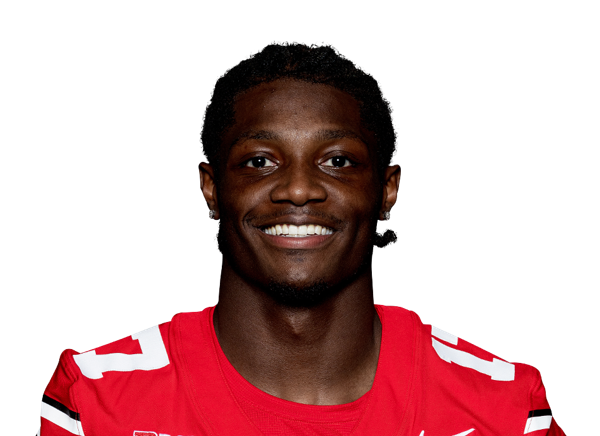 Carnell TateTENWRRole change Carnell TateTENWRRole change | Target share22% → 34%+13Snap share72% → 86%+14 | 16.6 | 86% | The TEN staff is using Carnell Tate more: 86% of snaps over the last two games against 72% before. |
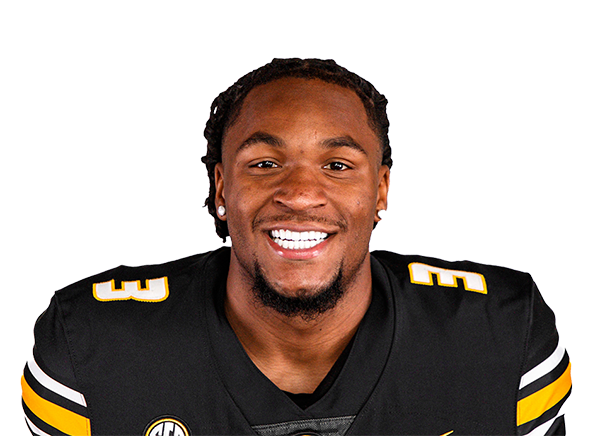 Luther Burden IIICHIWRRole change Luther Burden IIICHIWRRole change | Target share15% → 26%+11Snap share48% → 59%+11 | 15.6 | 90% | The CHI staff is using Luther Burden III more: 59% of snaps over the last two games against 48% before. |
 Tee HigginsCINWRRole change Tee HigginsCINWRRole change | Target share20% → 25%+5Snap share74% → 86%+12 | 23.9 | 97% | More snaps (74% → 86%) and more targets (20% → 25%) point to a real role change for Tee Higgins, the kind that has held up best in our backtests. |
 Dohnte MeyersCINWRRole change Dohnte MeyersCINWRRole change | Target share4% → 15%+11Snap share21% → 73%+52 | 10.6 | 0% | More snaps (21% → 73%) and more targets (4% → 15%) point to a real role change for Dohnte Meyers, the kind that has held up best in our backtests. |
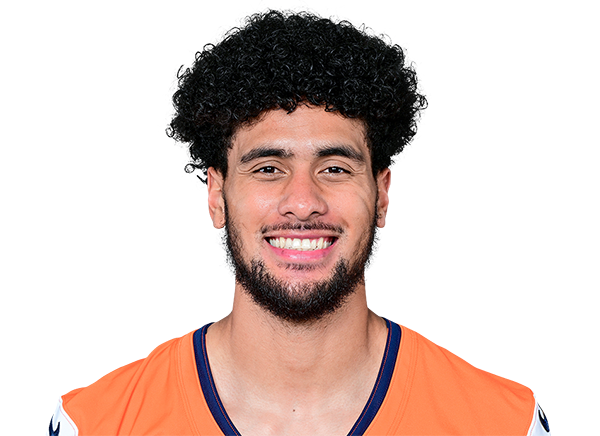 Devaughn VeleNOWRRole change Devaughn VeleNOWRRole change | Target share12% → 17%+5Snap share63% → 89%+25 | 12.1 | 65%▼1 | The NO staff is using Devaughn Vele more: 89% of snaps over the last two games against 63% before. |
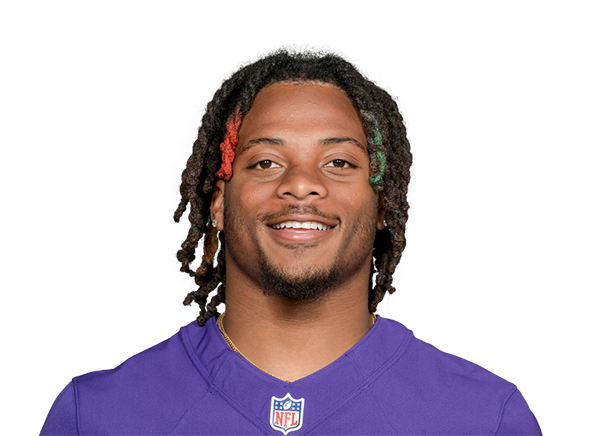 Keaton MitchellLACRBRole change Keaton MitchellLACRBRole change | Carry share15% → 30%+15Snap share21% → 38%+16 | 12.5 | 18% | AddThe LAC staff is using Keaton Mitchell more: 38% of snaps over the last two games against 21% before. |
 Ryan FlournoyDALWRRole change Ryan FlournoyDALWRRole change | Target share13% → 16%+3Snap share55% → 70%+15 | 6.0 | 5% | AddMore snaps (55% → 70%) and more targets (13% → 16%) point to a real role change for Ryan Flournoy, the kind that has held up best in our backtests. |
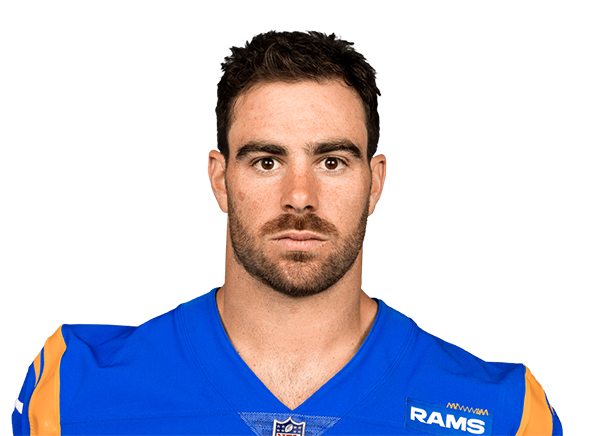 Tyler HigbeeLARTERole change Tyler HigbeeLARTERole change | Target share8% → 17%+9Snap share42% → 68%+26 | 15.9 | 2% | Tyler Higbee’s role has grown: snap share 42% → 68% and target share 8% → 17%. |
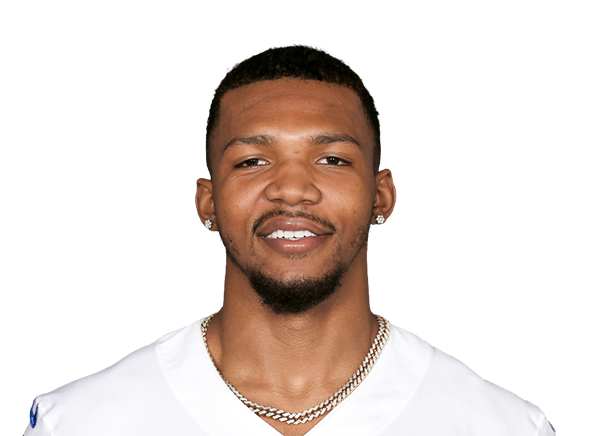 Tony PollardTENRBUsage growth Tony PollardTENRBUsage growth | Carry share55% → 71%+16Snap share56% → 53%−3 | 13.3 | 86% | Tony Pollard’s carry share rose 55% → 71% without more snaps. Gains like this kept only about a quarter of their size the next week in 2024–25, so bid modestly. |
 Bhayshul TutenJAXRBRole change Bhayshul TutenJAXRBRole change | Carry share29% → 56%+27Snap share31% → 54%+23 | 14.1 | 93% | Bhayshul Tuten’s role has grown: snap share 31% → 54% and carry share 29% → 56%. |
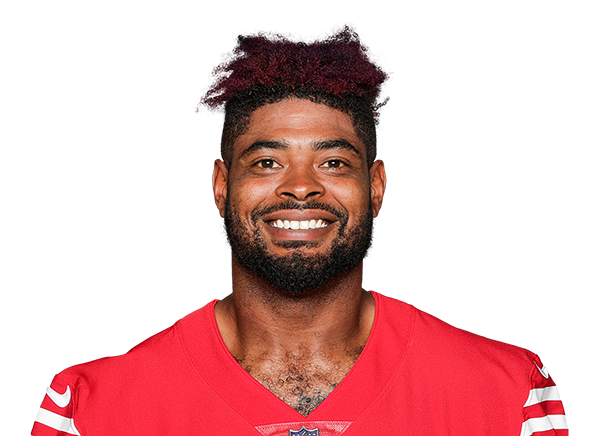 Jauan JenningsMINWRRole change Jauan JenningsMINWRRole change | Target share16% → 6%−10Snap share71% → 88%+17 | 1.5 | 8% | Jauan Jennings’ role has grown: snap share 71% → 88% and target share 16% → 6%. |
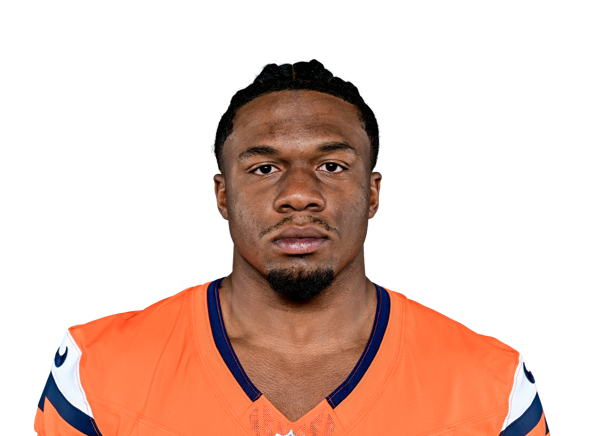 RJ HarveyDENRBInjury opening RJ HarveyDENRBInjury opening | Target share11% → 24%+14Snap share42% → 40%−2 | 15.0 | 71% | Jonah Coleman and Tyler Badie’s injury left 21% of the DEN targets up for grabs, and RJ Harvey has absorbed 35% of it (target share 11% → 24%). |
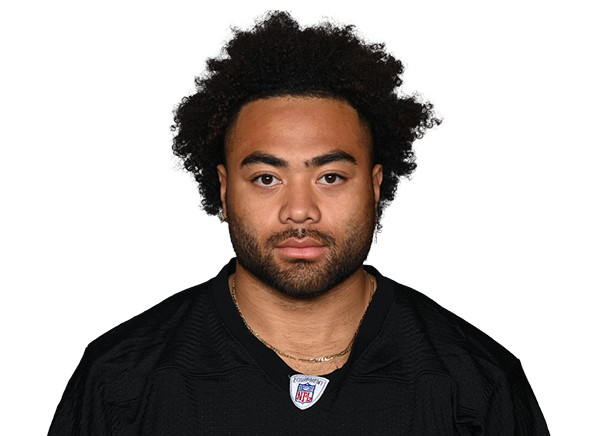 Jaylen WarrenPITRBInjury opening Jaylen WarrenPITRBInjury opening | Carry share51% → 82%+31Snap share50% → 94%+44 | 18.1 | 91% | With Rico Dowdle out, Jaylen Warren’s carry share jumped from 51% to 82% over the last two games. |
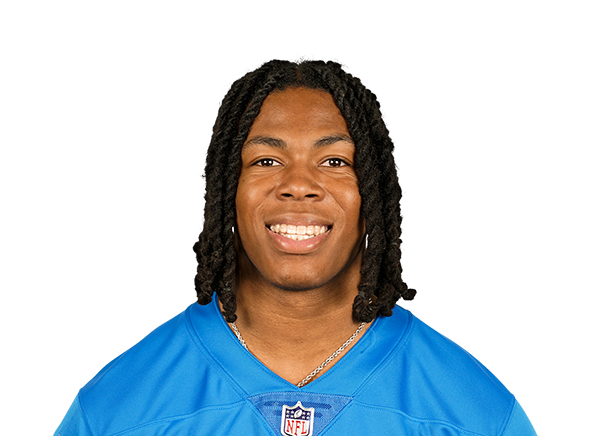 Jahmyr GibbsDETRBRole change Jahmyr GibbsDETRBRole change | Carry share62% → 83%+21Snap share68% → 78%+10 | 29.5 | 100% | The DET staff is using Jahmyr Gibbs more: 78% of snaps over the last two games against 68% before. |
 Isaac TeSlaaDETWRRole change Isaac TeSlaaDETWRRole change | Target share6% → 13%+7Snap share50% → 65%+15 | 11.6 | 2% | Isaac TeSlaa’s role has grown: snap share 50% → 65% and target share 6% → 13%. |
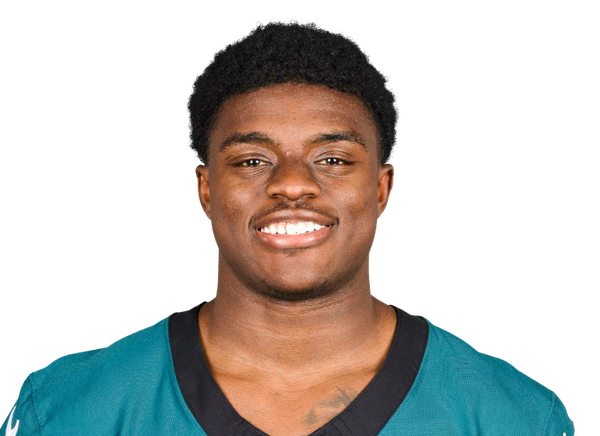 Darius CooperPHIWRInjury opening Darius CooperPHIWRInjury opening | Target share4% → 14%+10Snap share27% → 50%+23 | 9.2 | 0% | Dallas Goedert’s injury left 14% of the PHI targets up for grabs, and Darius Cooper has absorbed 71% of it (target share 4% → 14%). |
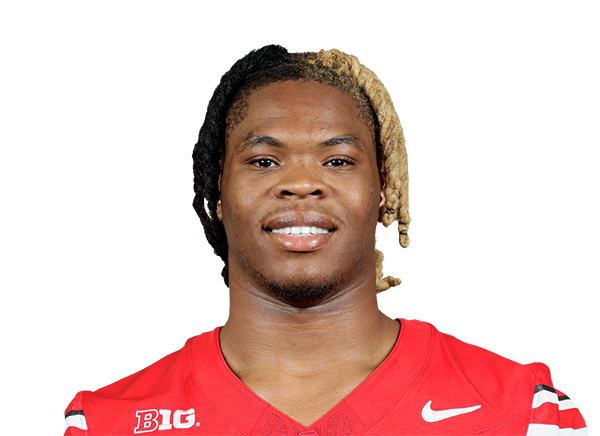 Quinshon JudkinsCLERBUsage growth Quinshon JudkinsCLERBUsage growth | Target share9% → 14%+5Snap share53% → 59%+5 | 15.8 | 95% | Quinshon Judkins’ target share rose 9% → 14% without more snaps. Gains like this kept only about a quarter of their size the next week in 2024–25, so bid modestly. |
Next: Waiver wire rankings · Snap counts · Target share · Injury report
How this works
Shares are per team game: snap %, target share, carry share and red-zone share. “Before” is the player’s earlier games this season, shrunk toward last season’s average (4 games of weight) or, for rookies, a fringe role. “Last 2” is his team’s last two games, with byes skipped. A riser’s score is the expected change in opportunity points next game, calibrated by cause and position on 2024–25 data (the next game keeps 0.25–0.95 of the change, depending on cause and position).
Points use your scoring format. The verdict chip comes from this week’s waiver rankings (12-team PPR); the sentence is a template filled from these numbers. Fallers who missed games with a short-term injury are holds, not drops.
Sources: nflverse play-by-play and snap counts, ESPN rostered %, Fantasy Nerds add trendUpdated Tue, Oct 6, 2:39 PM ET
Frequently asked questions
What is a usage riser?
A player whose snaps, targets or carries over his team’s last two games are well above his baseline (his earlier games this season, shrunk toward last season or a positional prior). We list him when the expected gain is at least 1.25 opportunity points per game, or when his snap share jumped 12+ points.
Do usage risers keep their role?
Partly. In 2024–25, the next game kept about 45% of a riser’s gain in opportunity points and 72% of a snap-share gain. Role changes and depth chart promotions held up best; target spikes at steady snaps kept only about a quarter.
What do the cause tags mean?
Injury opening: a teammate with a real role missed the last games. Depth chart promotion: he is now listed as a starter or replaced a benched starter. Role change: his snap share rose 10+ points. Usage growth: more targets or carries at steady snaps. Efficiency spike: points well above his usage (regression risk).
Why does a riser have no Add chip?
The chip comes from our waiver rankings: he is either rostered in too many leagues or his rest-of-season projection is below the 12-team waiver line. Drop chips mark fallers on the drop list.