
WR · Kansas City Chiefs
Andrew Armstrong fantasy stats and usage
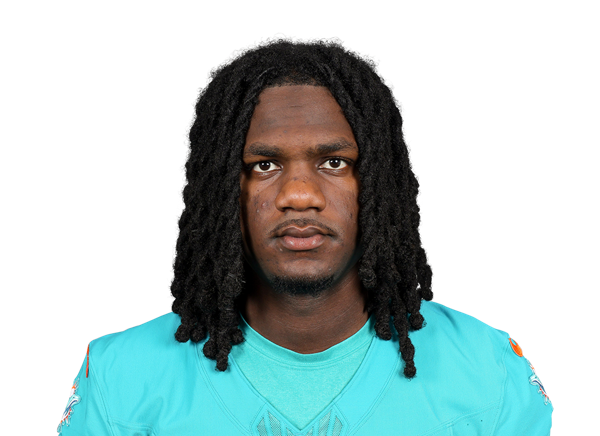
- Team
- KCWR
- Age
- 25
- Bye
- Week 5
- Status
- No injury designation
Role:Outside ZWeek 9, from games before kickoff · what roles mean
- AscensionSteady60· 14% chance of a top-24 week in the next 3
- Depth chart: WR6 (nflverse)
More
Next: Week 8 @ DEN, Sun 4:25 PM ET; Chiefs implied for 21 points
Matchup edges: none this week. None of the 18 matchup angles we tested for WRs (blitz, man coverage, two-high shells, boxes, play action and more) predicted points beyond our projection. See the tests and track record
Player props · Week 8
- Vegas prices an anytime TD at 8%; we project 0.19 TDs
Line history and our record · For information and entertainment only; not betting advice. Lines are a pregame consensus of US sportsbooks via The Odds API and change quickly. 21+. Gambling problem? Call 1-800-GAMBLER.
Usage by week
Snap share
58%▼112026 avg 64%
Target share
6%▼12026 avg 7%
Carry share
0%2026 avg 0%
Air-yards share
2%▼112026 avg 7%
2026 season
Carries / team rush attempts.
2026: 4 targets, 0 carries, 1 red-zone opportunities and 0 goal-line carries in 2 games.
What he does well
Outside ZAndrew Armstrong profiles as a outside z / flanker going into Week 9, built only from games before kickoff (a small sample, so it leans on his position’s averages).
Outside Z / flankers league-wide, 2023–25: 0.18 targets and 1.48 yards per route, 63% catch rate, 11.4 aDOT, 7.1 PPR points per game.
His role vs defensive schemes (2023–25)
- COutside Z / flanker: −8% yards per route vs soft middlerelative to other WRs (soft middle vs other D)
- COutside Z / flanker: −7% yards per route vs manrelative to other WRs (man vs zone)
- COutside Z / flanker: +3% yards per route vs man-heavy Drelative to other WRs (man-heavy D vs other D)
- COutside Z / flanker: −2% targets per route vs manrelative to other WRs (man vs zone)
His situations: yards per route in vs out (2 games before Week 9)
| Situation | Estimate | His raw | Role | Routes | Grade |
|---|---|---|---|---|---|
| on play action vs straight dropbacks | +25% | −86% | +25% | 9 | F |
| vs the blitz vs no blitz | +10% | −88% | +10% | 11 | F |
| vs soft-cushion defenses vs tighter defenses | +3% | +256% | +3% | 22 | F |
| in the red zone vs outside it | −60% | – | −60% | 3 | F |
| vs two-high defenses vs other defenses | −4% | – | −4% | 44 | F |
| on 3rd and 4th down vs early downs | −1% | −91% | −1% | 14 | F |
A player’s own split barely repeats from one half-season to the next (grades F and C), so the estimate stays close to his role’s. Read his raw number as history, not a prediction.
Game by game, 2026: what he did in each game (descriptive)
- W6 LAC Slot
- W7 SEA Outside Z
Roles are estimated from play-by-play, FTN charting (FTN Data via nflverse), Next Gen Stats cushion and the depth chart, not charted alignment. How roles work
Breakout outlook and route depth
50 = no change. 60+ rising, 75+ surging; 40 and under cooling, 25 and under falling.
Steady Route share 35% → 68% (est.) and snap share 35% → 64% in a bigger role; 14% chance of a top-24 week in the next 3. All breakout candidates
Route share (est.)
68%
Targets per route (est.)
0.08
Yards per route (est.)
0.32
aDOT
4.3
air yards per target
Air-yards share
7%
Routes (est.)
50
4 targets in 2 games
Estimates: nflverse participation data stops after 2025, so 2026 route share comes from his snap share, a position adjustment and his 2025 rate (typical error about 4 points over a season). Pass blockers count as on the field.
Andrew Armstrong
Over expected: Andrew Armstrong
- FPOE/G (PPR)
- −2.3
- Last 3
- −2.3
- Pts/G
- 1.8
- xFP/G
- 4.0
Only 2 games with usage so far: too early to call.
Bars: PPR points over expected by week. Over Expected leaderboard
Projection
Week 8 vs DEN · Edgehalla model (nfl-1.2.0)
5.1 PPR pts
80% range 0–11 · plays ~98% (points assume he plays)
- Targets
- 3
- Rec
- 2
- Rec yds
- 22
- Carries
- 0
- Rush yds
- 0
- Scrimmage TD
- 0.2
Latest news
- Rashee Rice misses practice Wednesday
FF Today · · via Fantasy Nerds
- Chiefs Week 6 snap count analysis: Andrew Armstrong steps up
Yahoo Sports · · via Fantasy Nerds
Depth chart: WR6 per nflverse (Oct 30, 2:03 AM ET) · LWR3 per Fantasy Nerds (Oct 27, 11:00 AM ET) · full Chiefs depth chart
Game log
Regular season. Fantasy points are calculated from the box score in the scoring format you pick above.
- Games
- 2
- Total (PPR)
- 3.6
- Per game
- 1.8
| Opp | |||||||||
|---|---|---|---|---|---|---|---|---|---|
| 6 | vs LAC | 69% | 2 | 1 | 13 | 0 | 0 | 0 | 2.3 |
| 7 | @ SEA | 58% | 2 | 1 | 3 | 0 | 0 | 0 | 1.3 |
Splits
Fantasy points per game at home vs away, and against defenses grouped by how many points they allowed to WRs that season (simple season averages, not adjusted for schedule). Early in the season these groups rest on a handful of games each.
2026: home vs away
| Split | G | PPR/G | vs avg |
|---|---|---|---|
| Home | 1 | 2.3 | +0.5 |
| Away | 1 | 1.3 | -0.5 |
2026: by opponent defense vs WR
| Split | G | PPR/G | vs avg |
|---|---|---|---|
| Tough defenses (ranks 1–8) | 1 | 1.3 | -0.5 |
| Middle defenses (9–24) | 1 | 2.3 | +0.5 |
| Soft defenses (25–32) | 0 | – | – |
Receiver and tight end data stories
How the game changed, told through the numbers.
- The Pass Revolution Was Over by 1999 Passes and sacks went from about 42 in every 100 plays in 1977 to 57 in 1995.
- The Running-Back Cliff Barely Moved. Fewer Backs Reach It. In 2003, backs aged 28 or older got a third of NFL running-back carries.
- The Workhorse Running Back Is Back, but Only to the Late 2010s In the early 2000s the average NFL lead back got about 66 of every 100 running-back carries.
How this works
Snap share is the share of the Chiefs’ offensive snaps he played. Target share and air-yards share are his share of the team’s targets and air yards; carry share is his carries divided by team rush attempts. Red-zone opportunities count targets and carries inside the opponent’s 20; goal-line carries are inside the 5.
The “what changed” line compares the average of his last two games with the up to four games before them and only appears when snap share moves 10 points, target share 5 points or carry share 10 points. Route participation is approximated by the share of team dropbacks he was on the field for (nflverse participation data, available through 2025).
Sources: nflverse, Fantasy Nerds (news, adds/drops, interim projections, depth)Updated through Week 7 2026
Frequently asked questions
How many fantasy points does Andrew Armstrong score per game in 2026?
Andrew Armstrong averages 1.8 PPR points per game over 2 games in 2026 (1.3 in half-PPR, 0.8 in standard scoring).
What is Andrew Armstrong’s snap share and role?
Andrew Armstrong has played 64% of the Kansas City Chiefs’ offensive snaps on average in 2026, with a 7% target share. He has 1 red-zone opportunities (targets plus carries) this season.
When is Andrew Armstrong’s bye week?
The Kansas City Chiefs have their bye in Week 5, so Andrew Armstrong won’t play that week.