

Josh Doan · 1st 5:58 · BUF
- Play
- dump-and-chase
- Entry
- dump
- Odd man
- 2-on-1
- Passes
- 2
- Shot
- 62.5 mph
- Distance
- 35 ft
- Entry to goal
- 1.7 s
Watch on NHL.com → · Tracking-derived via NHL EDGE
| Goals | 1 | 2 | 3 | T | Shots | 1 | 2 | 3 | T | |
|---|---|---|---|---|---|---|---|---|---|---|
| FLA | 1 | 2 | 0 | 3 | FLA | 7 | 7 | 9 | 23 | |
| BUF | 2 | 1 | 2 | 5 | BUF | 11 | 13 | 8 | 32 |

Game-winning goalNoah Ostlund · 3rd 7:15 · PP · the Sabres' 4th goal, 7:15 of the 3rd period (power play), made it 4-3.
Every goalEvery goal and how the winner changed →Generated from the play-by-play, shifts and season context. No opinions, just what changed.
Buffalo Sabres beat Florida Panthers 5–3 at home. Sam Reinhart (FLA) led the scoring with 2G 0A. FLA's first power-play unit (Verhaeghe, Jones, Reinhart, Tkachuk and Tkachuk) scored 2 power-play goals on 12 attempts in 2:37 together.
 ★ First starNoah OstlundBUF · C · 1 G
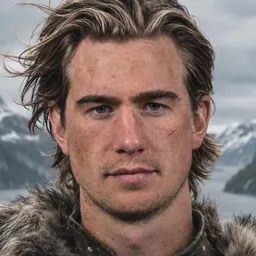 ★★ Second starRyan McLeodBUF · C · 1 G
 ★★★ Third starJack QuinnBUF · R · 2 A
Referees: Carter Sandlak (#29), Eric Furlatt (#27) · Linesmen: James Tobias (#61), Joe Mahon (#89)
Both teams on one rink, filtered by strength and period.
Every attempt, sized by expected goals. Goals are rings, shots on goal dots, misses hollow, blocks crosses.
Shot map, FLA at BUF: 112 attempts, 55 on goal, 8 goals, 6.77 expected goals; best chance Sam Reinhart at 0.81 xG.
Showing 112 of 112 attempts · BUF 49 · FLA 63
Cumulative expected goals and shot attempts, with power plays shaded and goals marked.
Game flow, FLA at BUF: expected goals 3.44 to 3.33 (BUF led the chances), shot attempts 49 to 63, 8 goals.
: descriptive only, the team with more pressure scored the next goal about half the time. In control: FLA 34% of the game, BUF 25%.
Every shift, grouped by line and pair; bars are coloured by strength state. Click a player to highlight.
Shift chart, FLA at BUF: 40 players over 60:00; most ice Ukko-Pekka Luukkonen (33:34) for BUF and Akira Schmid (38:08) for FLA, 8 goals.
BUF skaters (rows) against FLA skaters (columns) at 5v5. Square size is time together; colour is xGF% from the BUF side.
Head-to-head matrix, BUF rows versus FLA columns: 250 matchups; most common Zellweger vs Jones, 11:18 at 78% xGF.
5-on-5 possession-chain numbers from the sequence engine (Draw Equity and control cover all situations).
| Stat | FLA | BUF |
|---|---|---|
| 50 | 47 | |
| 1.40 | 2.64 | |
| 1.36 | 2.57 | |
| 6 | 8 | |
| 6 | 1 | |
| 16 | 17 | |
| +0.031 | −0.031 | |
| 34% | 25% |
Definitions: sequence xG, transition attempts, Draw Equity, control and the Pressure Index.
Detected from who actually shared the ice, with time together. Percentages are the unit's share of shot attempts.
 Florida Panthers
 Buffalo Sabres
Every goal with the skaters on the ice for it.
Skaters grouped by the line they played on; CF% is the 5v5 share of shot attempts while on the ice.
Florida Panthers| Skater | Line | G | A | P | +/- | Hits | Blk | PIM | PP | SH | |||||
|---|---|---|---|---|---|---|---|---|---|---|---|---|---|---|---|
| Sam Reinhart C | L1 | 2 | 0 | 2 | -1 | 2 | 1.09 | 2 | 0 | 0 | 20:27 | — | — | 42 | 13 |
| Carter Verhaeghe C | L1 | 0 | 0 | 0 | -1 | 0 | 0.14 | 0 | 0 | 0 | 17:37 | — | — | 42 | 13 |
| Sam Lafferty C | L1 | 0 | 0 | 0 | -1 | 0 | 0.00 | 2 | 1 | 0 | 14:54 | — | — | 26 | 5 |
| Matthew Tkachuk L | L2 | 0 | 1 | 1 | -2 | 2 | 0.02 | 1 | 0 | 0 | 18:25 | — | — | 57 | 25 |
| Brady Tkachuk L | L2 | 0 | 1 | 1 | -2 | 3 | 0.52 | 7 | 0 | 0 | 16:32 | — | — | 54 | 20 |
| Sam Bennett C | L2 | 0 | 0 | 0 | -2 | 1 | 0.04 | 2 | 0 | 0 | 15:34 | — | — | 52 | 40 |
| Eetu Luostarinen C | L3 | 0 | 0 | 0 | +1 | 2 | 0.13 | 4 | 1 | 2 | 16:37 | — | — | 62 | 58 |
| Anton Lundell C | L3 | 1 | 0 | 1 | +1 | 3 | 0.26 | 3 | 0 | 0 | 14:51 | — | — | 61 | 64 |
| Sandis Vilmanis L | L3 | 0 | 1 | 1 | +1 | 0 | 0.00 | 0 | 1 | 0 | 12:21 | — | — | 70 | 68 |
| Lars Eller C | L4 | 0 | 0 | 0 | 0 | 0 | 0.17 | 1 | 0 | 0 | 12:36 | — | — | 53 | 46 |
| Garnet Hathaway R | L4 | 0 | 0 | 0 | 0 | 1 | 0.23 | 5 | 1 | 0 | 10:05 | — | — | 46 | 68 |
| Bokondji Imama L | L4 | 0 | 0 | 0 | 0 | 0 | 0.00 | 1 | 0 | 0 | 8:56 | — | — | 42 | 65 |
| Gustav Forsling D | D1 | 0 | 0 | 0 | -1 | 2 | 0.14 | 0 | 0 | 0 | 24:10 | — | — | 60 | 55 |
| Aaron Ekblad D | D1 | 0 | 1 | 1 | -1 | 3 | 0.23 | 3 | 0 | 4 | 20:25 | — | — | 66 | 58 |
| Seth Jones D | D2 | 0 | 2 | 2 | -1 | 4 | 0.33 | 2 | 0 | 0 | 23:55 | — | — | 48 | 28 |
| Niko Mikkola D | D2 | 0 | 0 | 0 | -1 | 0 | 0.01 | 5 | 0 | 0 | 19:48 | — | — | 47 | 25 |
| Dmitry Kulikov D | D3 | 0 | 0 | 0 | 0 | 0 | 0.00 | 4 | 0 | 2 | 14:32 | — | — | 33 | 3 |
| Radko Gudas D | D3 | 0 | 0 | 0 | 0 | 0 | 0.02 | 0 | 1 | 2 | 12:27 | — | — | 40 | 14 |
| Goalie | Dec | SA | SV | GA | TOI | ||
|---|---|---|---|---|---|---|---|
| Akira Schmid | L | 21 | 18 | 3 | .857 | 1.55 | 38:08 |
| Jacob Markstrom(start) | — | 11 | 9 | 2 | .818 | 1.44 | 20:00 |
Buffalo Sabres| Skater | Line | G | A | P | +/- | Hits | Blk | PIM | PP | SH | |||||
|---|---|---|---|---|---|---|---|---|---|---|---|---|---|---|---|
| Tage Thompson C | L1 | 1 | 1 | 2 | +1 | 1 | 0.24 | 2 | 1 | 0 | 17:58 | — | — | 39 | 60 |
| Josh Doan R | L1 | 1 | 0 | 1 | +2 | 3 | 0.33 | 0 | 2 | 0 | 16:15 | — | — | 48 | 70 |
| Peyton Krebs C | L1 | 0 | 2 | 2 | +1 | 0 | 0.08 | 2 | 1 | 0 | 15:08 | — | — | 47 | 65 |
| Zach Benson L | L2 | 0 | 1 | 1 | 0 | 2 | 0.59 | 0 | 1 | 0 | 19:40 | — | — | 59 | 80 |
| Noah Ostlund C | L2 | 1 | 0 | 1 | 0 | 3 | 0.19 | 0 | 0 | 0 | 17:54 | — | — | 50 | 52 |
| Jack Quinn R | L2 | 0 | 2 | 2 | 0 | 1 | 0.09 | 0 | 0 | 0 | 17:35 | — | — | 60 | 65 |
| Ryan McLeod C | L3 | 1 | 0 | 1 | +1 | 2 | 0.23 | 0 | 1 | 0 | 16:04 | — | — | 52 | 79 |
| Konsta Helenius C | L3 | 0 | 0 | 0 | 0 | 1 | 0.02 | 0 | 0 | 0 | 14:52 | — | — | 33 | 53 |
| Jiri Kulich C | L3 | 0 | 0 | 0 | +1 | 2 | 0.10 | 1 | 1 | 0 | 13:52 | — | — | 42 | 56 |
| Josh Norris C | L4 | 0 | 0 | 0 | 0 | 2 | 0.32 | 0 | 1 | 4 | 11:24 | — | — | 60 | 67 |
| Tyson Kozak C | L4 | 0 | 0 | 0 | 0 | 0 | 0.00 | 1 | 0 | 0 | 10:46 | — | — | 50 | 63 |
| Beck Malenstyn L | L4 | 0 | 0 | 0 | 0 | 0 | 0.45 | 4 | 2 | 2 | 9:56 | — | — | 80 | 94 |
| Olen Zellweger D | D1 | 0 | 1 | 1 | 0 | 6 | 0.48 | 0 | 0 | 2 | 20:03 | — | — | 48 | 67 |
| Louis Crevier D | D1 | 0 | 0 | 0 | 0 | 2 | 0.06 | 3 | 2 | 0 | 15:03 | — | — | 40 | 62 |
| Owen Power D | D2 | 0 | 2 | 2 | +3 | 1 | 0.00 | 0 | 0 | 0 | 26:31 | — | — | 51 | 64 |
| Zach Metsa D | D2 | 0 | 0 | 0 | +1 | 0 | 0.00 | 0 | 3 | 0 | 15:38 | — | — | 65 | 78 |
| Mattias Samuelsson D | D3 | 0 | 0 | 0 | 0 | 2 | 0.05 | 1 | 1 | 0 | 26:59 | — | — | 44 | 55 |
| Rasmus Dahlin D | D3 | 1 | 0 | 1 | 0 | 4 | 0.22 | 0 | 1 | 0 | 9:06 | — | — | 44 | 76 |
| Goalie | Dec | SA | SV | GA | TOI | ||
|---|---|---|---|---|---|---|---|
| Ukko-Pekka Luukkonen | W | 14 | 13 | 1 | .929 | 1.75 | 33:34 |
| Colten Ellis(start) | — | 9 | 7 | 2 | .778 | 1.58 | 26:26 |
Animated replays from NHL EDGE tracking, with the entry, passes and shot speed for each goal.
Josh Doan (BUF) 1st 5:58 · assists Peyton Krebs · Dump and chase · dumped in · 2-on-1 at the blue line · 62.5 mph shot · 1.7 s from entry to goal.
Watch on NHL.com → · Tracking-derived via NHL EDGE
Watch on NHL.com → · Tracking-derived via NHL EDGE
Watch on NHL.com → · Tracking-derived via NHL EDGE
Watch on NHL.com → · Tracking-derived via NHL EDGE
Watch on NHL.com → · Tracking-derived via NHL EDGE
Watch on NHL.com → · Tracking-derived via NHL EDGE
Watch on NHL.com → · Tracking-derived via NHL EDGE
Watch on NHL.com → · Tracking-derived via NHL EDGE
Before the game we forecast every 5-on-5 player-vs-player pairing. It missed each pairing by 108 seconds on average, against 108 seconds for random mixing. It named one of a forward's two most-faced defencemen 32% of the time. Methodology
How the game changed, told through the numbers.