
Half PPR · 2026 · through Week 8
Kicker Fantasy Points Leaders
Every kicker ranked by 2026 Half PPR fantasy points, Weeks 1–8, with points per game, last-3 form and usage. Filter by week range, team or games played, or switch scoring.
Best per game, K
Points per game among players with 4+ games.
K leaders
- 1
 Will ReichardMIN13.5/g
- 2
 Spencer ShraderIND12.3/g
- 3
 Chase McLaughlinTB11.0/g
2026 K fantasy points leaders, Weeks 1–8
35 players · 2026 · Weeks 1–8
| # | |||||
|---|---|---|---|---|---|
| 1 | Spencer ShraderINDK | 7 | 86.0 | 12.3 | 19 |
| 2 | Will ReichardMINK | 6 | 81.0 | 13.5 | 18 |
| 3 | Chase McLaughlinTBK | 7 | 77.0 | 11.0 | 16 |
| 4 |  Ka'imi FairbairnHOUK | 7 | 75.0 | 10.7 | 15 |
| 5 |  Matt GayLVK | 7 | 71.0 | 10.1 | 17 |
| 6 |  Chad RylandARIK | 7 | 70.0 | 10.0 | 17 |
Rows 4–35 continue belowRows 7–35 continue below
Rows 4–35 of 35Rows 7–35 of 35
| # | |||||
|---|---|---|---|---|---|
| 4 | Ka'imi FairbairnHOUK | 7 | 75.0 | 10.7 | 15 |
| 5 | Matt GayLVK | 7 | 71.0 | 10.1 | 17 |
| 6 | Chad RylandARIK | 7 | 70.0 | 10.0 | 17 |
| 7 |  Chris BoswellPITK | 7 | 69.0 | 9.9 | 16 |
| 8 | 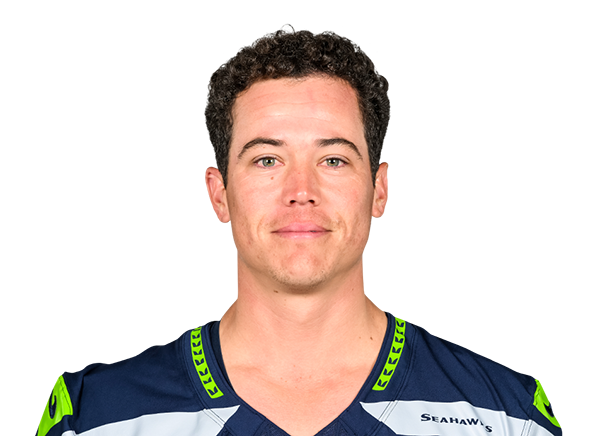 Jason MyersSEAK | 7 | 66.0 | 9.4 | 14 |
| 9 |  Tyler LoopBALK | 7 | 63.0 | 9.0 | 12 |
| 10 |  Cairo SantosCHIK | 7 | 60.0 | 8.6 | 11 |
| 11 | 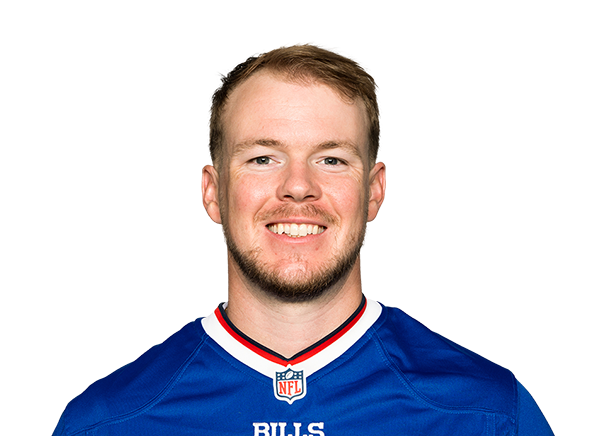 Tyler BassBUFK | 6 | 60.0 | 10.0 | 13 |
| 12 | 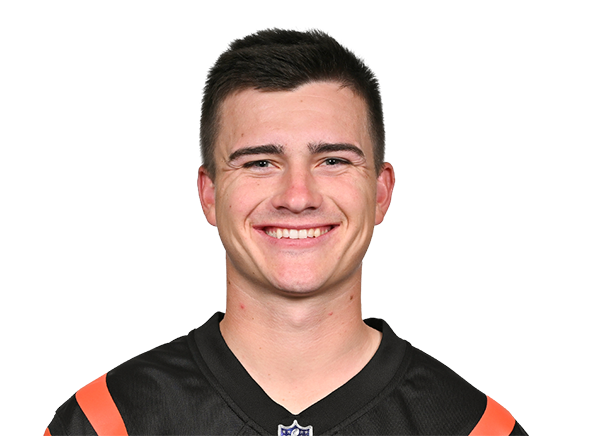 Evan McPhersonCINK | 6 | 59.0 | 9.8 | 10 |
| 13 |  Brandon AubreyDALK | 7 | 59.0 | 8.4 | 12 |
| 14 |  Andre SzmytCLEK | 7 | 59.0 | 8.4 | 14 |
| 15 |  Ryan FitzgeraldCARK | 7 | 59.0 | 8.4 | 13 |
| 16 |  Jake BatesDETK | 6 | 58.0 | 9.7 | 10 |
| 17 |  Dominic ZvadaNYGK | 7 | 57.0 | 8.1 | 13 |
| 18 | 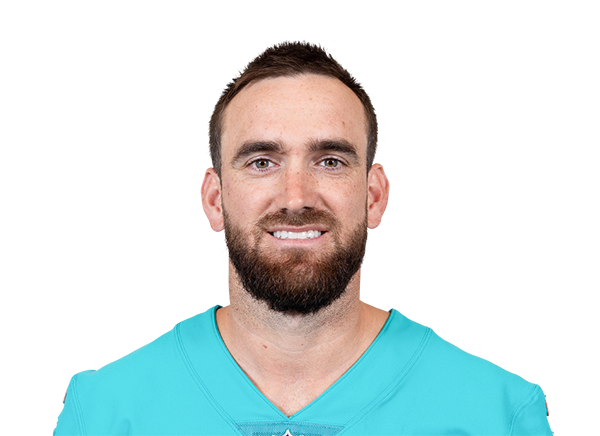 Jason SandersNYJK | 7 | 55.0 | 7.9 | 13 |
| 19 |  Cam LittleJAXK | 6 | 54.0 | 9.0 | 10 |
| 20 |  Nick FolkATLK | 7 | 53.0 | 7.6 | 12 |
| 21 |  Wil LutzDENK | 7 | 53.0 | 7.6 | 12 |
| 22 |  Trey SmackGBK | 8 | 50.0 | 6.3 | 11 |
| 23 |  Harrison ButkerKCK | 6 | 48.0 | 8.0 | 11 |
| 24 |  Andy BorregalesNEK | 7 | 46.0 | 6.6 | 9 |
| 25 |  Joey SlyeTENK | 7 | 44.0 | 6.3 | 10 |
| 26 |  Drew StevensWASK | 6 | 44.0 | 7.3 | 10 |
| 27 |  Daniel CarlsonNOK | 7 | 42.0 | 6.0 | 8 |
| 28 |  Eddy PineiroSFK | 7 | 38.0 | 5.4 | 6 |
| 29 |  Jake ElliottPHIK | 7 | 36.0 | 5.1 | 5 |
| 30 |  Cameron DickerLACK | 6 | 36.0 | 6.0 | 9 |
| 31 |  Harrison MevisLARK | 5 | 29.0 | 5.8 | 5 |
| 32 |  Riley PattersonMIAK | 5 | 24.0 | 4.8 | 7 |
| 33 |  Brandon McManusLARK | 1 | 5.0 | 5.0 | 0 |
| 34 |  Blake GrupeLARK | 1 | 4.0 | 4.0 | 1 |
| 35 |  Zane GonzalezMIAK | 1 | 4.0 | 4.0 | 0 |
More leaders and tools
Week 8 leaders · 2025 leaders · 2024 leaders · 2023 leaders · 2022 leaders · Projections · Who should I start? · Waiver wire · Over Expected (luck) · Snap counts · Target share · Red zone usage · Fantasy points allowed · DST streamers · Kicker streamers · Trade value
Kicking data stories
How the game changed, told through the numbers.
- The Kickoff Return Came Back. The Touchdowns Didn’t. For 13 years NFL rules pushed kickoffs into the end zone, and by 2023 only about one in five was returned.
- Kickers Broke the 50-Yard Line In 1999 a 50-yard field goal was close to a coin flip, and a team tried one about every six games.
- NFL Teams Punt Almost a Third Less. More Drives Now End in Points. NFL teams punted 3.55 times a game in 2025, the fewest since at least 1999.
How this works
Points come from each regular-season game’s box score, scored in the format you pick (PPR here by default; half PPR, standard, TE premium, 6-point passing TD, DraftKings and FanDuel under the scoring switch). Season pages add up every week so far; week pages show one week. Pts/G divides by games played; L3/G is the average of a player’s last three games in the range.
Snap % and target share count only the games a player played. Opp/G is targets plus carries per game; RZ counts targets and carries inside the opponent’s 20. Defense points allowed leave out points the opponent scored on its own defense or special teams (ESPN and Yahoo rule). Rostered % is the latest daily ESPN snapshot.
Sources: nflverse weekly stats, snap counts and play-by-play, ESPN rostered %Updated Fri, Oct 30, 9:33 AM ET
Frequently asked questions
How are fantasy points calculated?
From each game’s box score: 1 point per 10 rushing or receiving yards, 6 per rushing or receiving touchdown, 1 per 25 passing yards, 4 per passing touchdown, minus 2 per interception or lost fumble, 2 per two-point conversion. PPR adds 1 point per catch, half PPR 0.5 and standard none. Kickers score 3 to 5 per field goal by distance and 1 per extra point; defenses score sacks, takeaways, touchdowns and a points-allowed tier.
Which games count?
Regular-season games only. Week pages show one week; the season boards add up every week so far, and the week-range filter narrows them to any span, for example your fantasy playoff weeks.
Why rank by points per game as well as total?
A player who missed games trails on total points but may score more each week he plays. In our tests (2023 to 2026), ranking by per game changes 1 to 6 names in each position’s top 12 or 24, more than switching between PPR and half PPR does.
What do snap % and opportunity mean?
Snap % is the share of his team’s offensive plays he was on the field for, in the games he played. Opportunity is targets plus carries per game. Through week 7, opportunity predicted the rest of the season about as well as points per game did, so both are shown.
Can I use my league’s scoring?
Yes. Use More for TE premium, 6-point passing touchdowns, DraftKings or FanDuel scoring. Every table re-scores instantly, and your choice is remembered on every Edgehalla tool.