
Standard (non-PPR) · 2026 · through Week 8
QB Fantasy Points Leaders
Every quarterback ranked by 2026 Standard (non-PPR) fantasy points, Weeks 1–8, with points per game, last-3 form and usage. Filter by week range, team or games played, or switch scoring.
Best per game, QB
Points per game among players with 4+ games.
QB leaders
- 1
 Josh AllenBUF26.7/g
- 2
 Jared GoffDET22.2/g
- 3
 Joe BurrowCIN21.7/g
2026 QB fantasy points leaders, Weeks 1–8
61 players · 2026 · Weeks 1–8
| # | ||||
|---|---|---|---|---|
| 1 | Josh AllenBUFQB | 6 | 160.3 | 26.7 |
| 2 |  Jordan LoveGBQB | 8 | 148.8 | 18.6 |
| 3 | 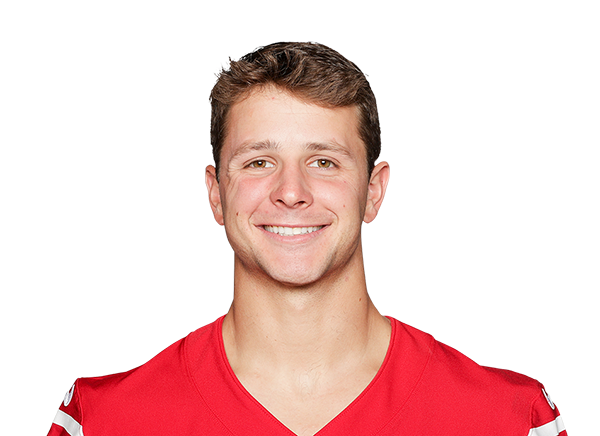 Brock PurdySFQB | 7 | 146.0 | 20.9 |
| 4 | 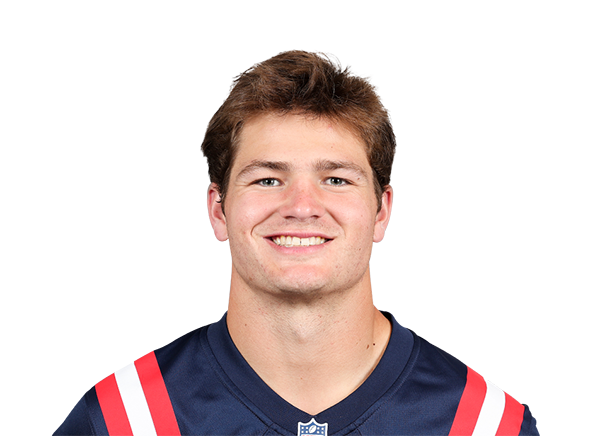 Drake MayeNEQB | 7 | 138.5 | 19.8 |
| 5 | Jared GoffDETQB | 6 | 133.0 | 22.2 |
| 6 | 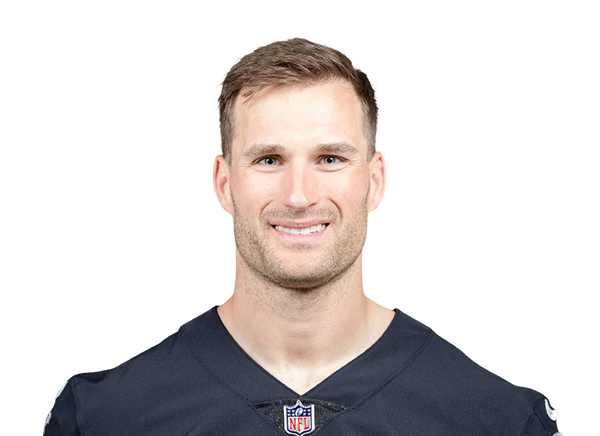 Kirk CousinsLVQB | 7 | 131.5 | 18.8 |
Rows 4–31 continue belowRows 7–31 continue below
Rows 4–31 of 61Rows 7–31 of 61
| # | ||||
|---|---|---|---|---|
| 4 | Drake MayeNEQB | 7 | 138.5 | 19.8 |
| 5 | Jared GoffDETQB | 6 | 133.0 | 22.2 |
| 6 | Kirk CousinsLVQB | 7 | 131.5 | 18.8 |
| 7 | Joe BurrowCINQB | 6 | 130.1 | 21.7 |
| 8 | 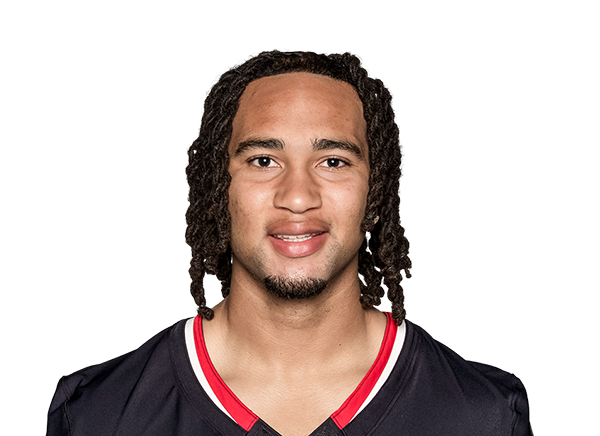 C.J. StroudHOUQB | 7 | 128.7 | 18.4 |
| 9 | 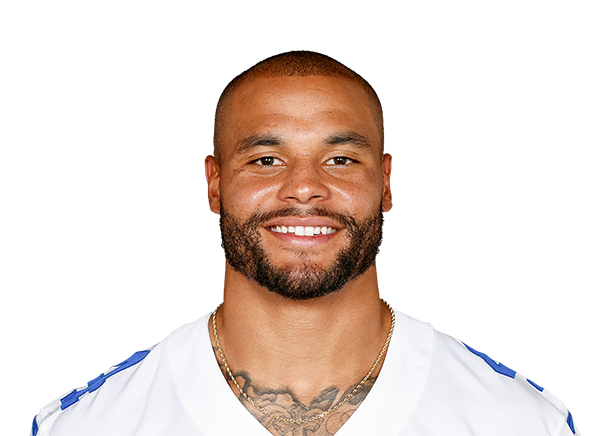 Dak PrescottDALQB | 7 | 128.1 | 18.3 |
| 10 | 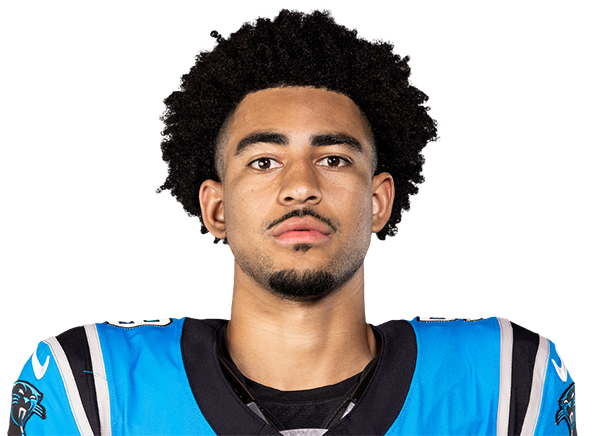 Bryce YoungCARQB | 7 | 126.2 | 18.0 |
| 11 |  Tyler ShoughNOQB | 7 | 125.9 | 18.0 |
| 12 | 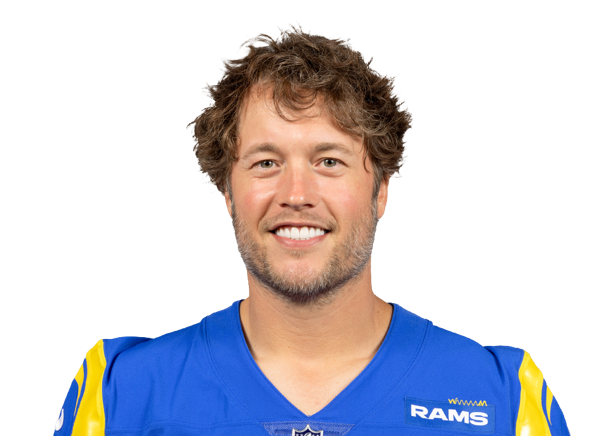 Matthew StaffordLARQB | 7 | 123.4 | 17.6 |
| 13 | 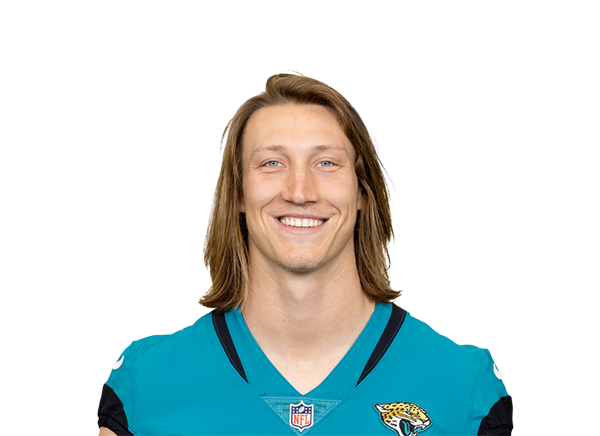 Trevor LawrenceJAXQB | 6 | 114.2 | 19.0 |
| 14 |  Aaron RodgersPITQB | 7 | 112.3 | 16.0 |
| 15 |  Deshaun WatsonCLEQB | 7 | 106.8 | 15.3 |
| 16 |  Jacoby BrissettARIQB | 7 | 106.7 | 15.2 |
| 17 |  Geno SmithNYJQB | 7 | 105.1 | 15.0 |
| 18 |  Patrick MahomesKCQB | 6 | 100.1 | 16.7 |
| 19 |  Bo NixDENQB | 7 | 95.8 | 13.7 |
| 20 |  Malik WillisMIAQB | 6 | 86.6 | 14.4 |
| 21 |  Jayden DanielsWASQB | 4 | 85.7 | 21.4 |
| 22 |  Michael Penix Jr.ATLQB | 5 | 84.7 | 16.9 |
| 23 |  Caleb WilliamsCHIQB | 4 | 83.6 | 20.9 |
| 24 |  Jalen HurtsPHIQB | 5 | 80.0 | 16.0 |
| 25 |  Lamar JacksonBALQB | 4 | 79.1 | 19.8 |
| 26 | 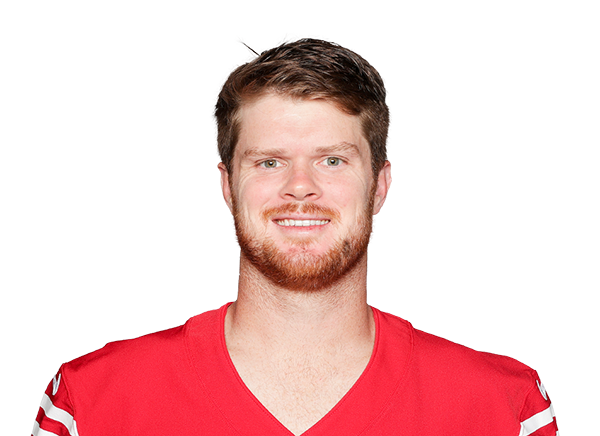 Sam DarnoldSEAQB | 6 | 74.8 | 12.5 |
| 27 | 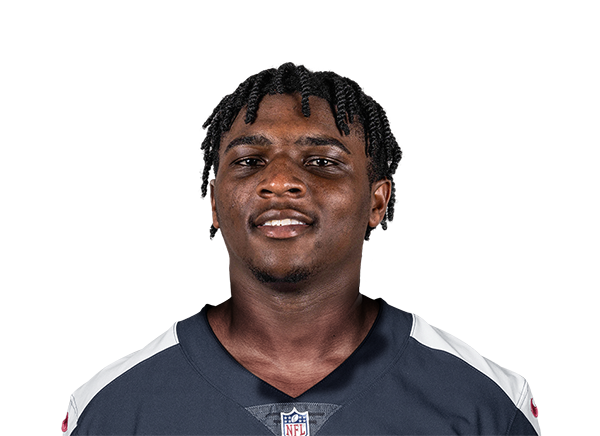 Cam WardTENQB | 7 | 74.3 | 10.6 |
| 28 | 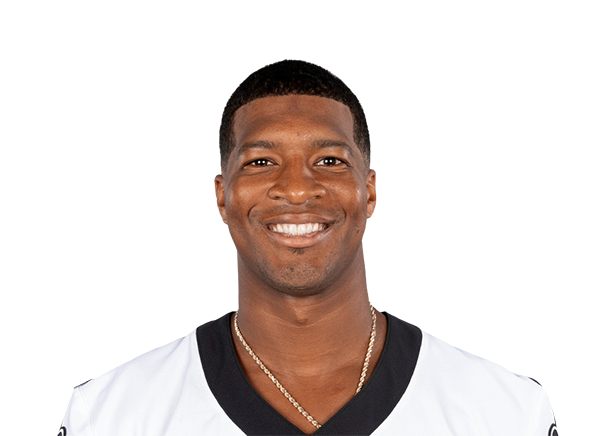 Jameis WinstonNYGQB | 6 | 65.3 | 10.9 |
| 29 | 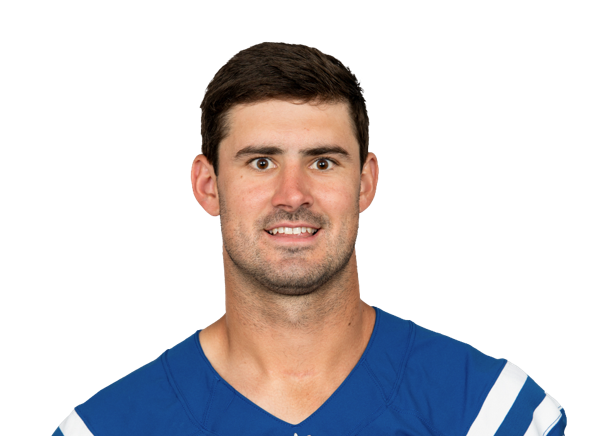 Daniel JonesINDQB | 7 | 64.7 | 9.2 |
| 30 |  Justin HerbertLACQB | 6 | 62.4 | 10.4 |
| 31 |  Tyler HuntleyBALQB | 4 | 56.7 | 14.2 |
Rows 32–61 continue below
Rows 32–61 of 61
| # | ||||
|---|---|---|---|---|
| 32 |  Kyler MurrayMINQB | 5 | 53.7 | 10.7 |
| 33 |  Baker MayfieldTBQB | 4 | 41.8 | 10.4 |
| 34 |  Marcus MariotaWASQB | 3 | 34.5 | 11.5 |
| 35 |  Drew LockSEAQB | 2 | 34.2 | 17.1 |
| 36 |  Jalon DanielsTBQB | 5 | 34.0 | 6.8 |
| 37 |  Jaxson DartNYGQB | 2 | 27.4 | 13.7 |
| 38 |  J.J. McCarthyNYGQB | 3 | 26.7 | 8.9 |
| 39 | 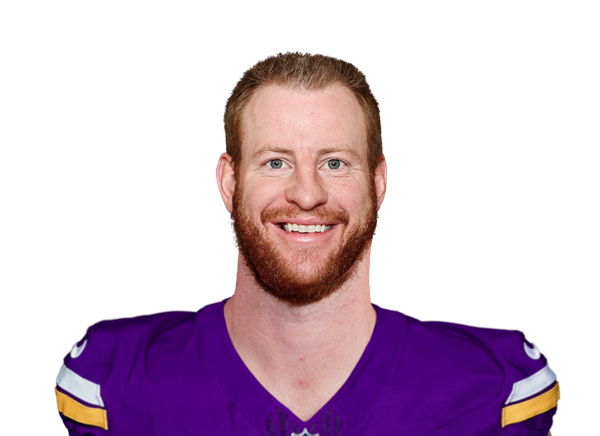 Carson WentzMINQB | 2 | 25.5 | 12.8 |
| 40 | 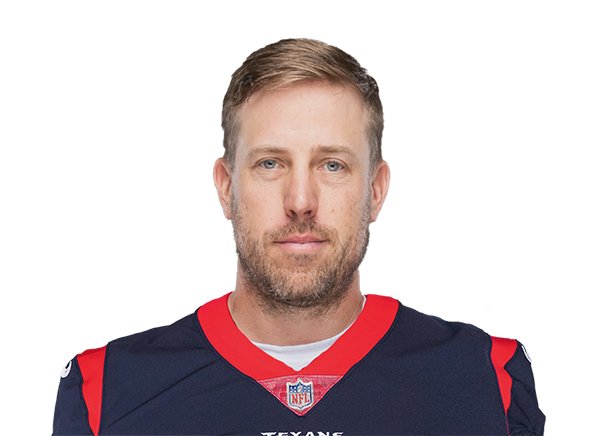 Case KeenumCHIQB | 3 | 25.2 | 8.4 |
| 41 | 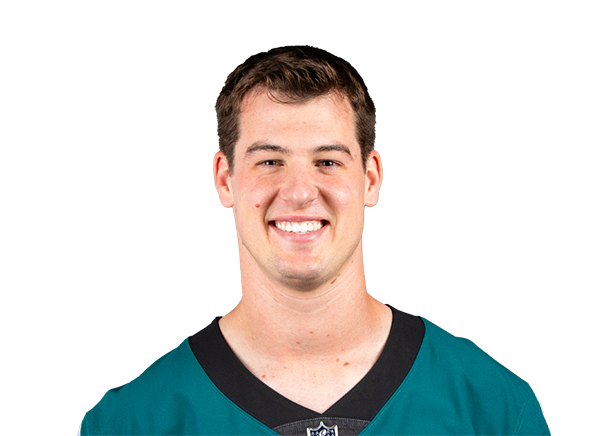 Tanner McKeePHIQB | 2 | 23.1 | 11.6 |
| 42 |  Tyson BagentCHIQB | 3 | 12.2 | 4.1 |
| 43 | 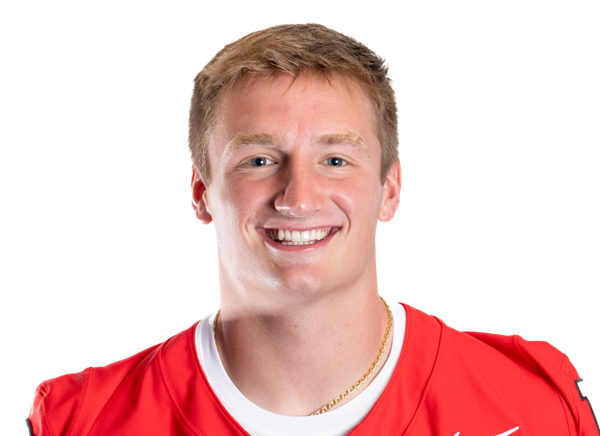 Athan KaliakmanisWASQB | 1 | 11.0 | 11.0 |
| 44 |  Kenny PickettCARQB | 3 | 5.4 | 1.8 |
| 45 |  Cooper RushATLQB | 2 | 5.2 | 2.6 |
| 46 |  Fernando MendozaLVQB | 1 | 2.2 | 2.2 |
| 47 |  Stetson BennettLARQB | 1 | 1.4 | 1.4 |
| 48 |  Tommy DeVitoNEQB | 1 | 1.4 | 1.4 |
| 49 |  Mason RudolphPITQB | 2 | 0.1 | 0.1 |
| 50 |  Justin FieldsKCQB | 1 | 0.0 | 0.0 |
| 51 |  Quinn EwersJAXQB | 1 | 0.0 | 0.0 |
| 52 |  Shedeur SandersCLEQB | 1 | 0.0 | 0.0 |
| 53 | 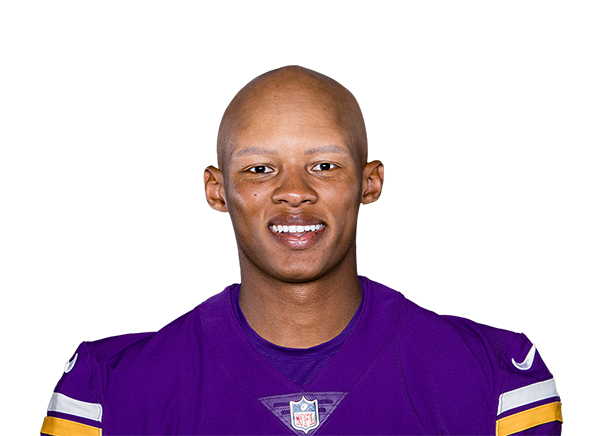 Joshua DobbsDETQB | 1 | 0.0 | 0.0 |
| 54 | 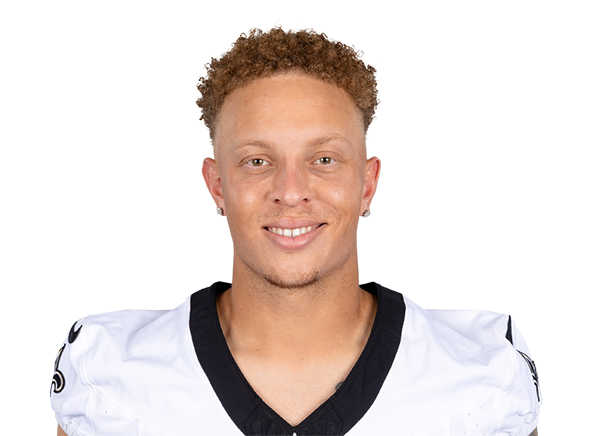 Spencer RattlerNOQB | 1 | 0.0 | 0.0 |
| 55 | 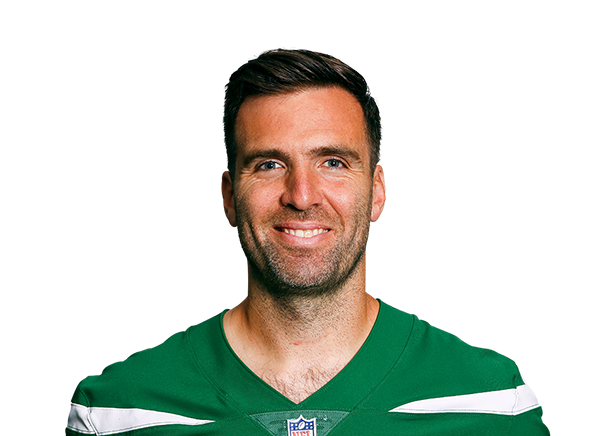 Joe FlaccoCINQB | 1 | 0.0 | 0.0 |
| 56 |  Jack StrandATLQB | 1 | -0.0 | -0.0 |
| 57 | 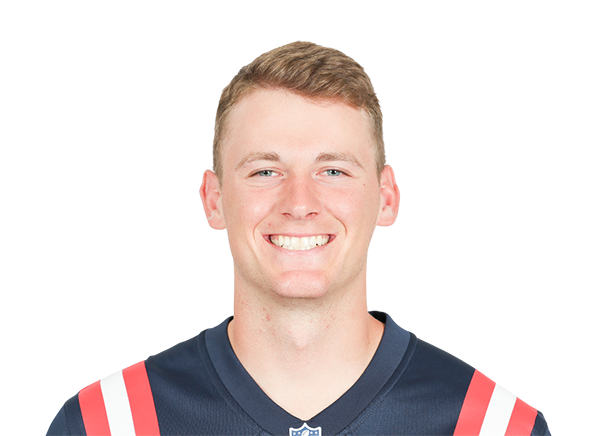 Mac JonesSFQB | 1 | -0.2 | -0.2 |
| 58 |  Tyrod TaylorGBQB | 1 | -0.2 | -0.2 |
| 59 |  Nick MullensJAXQB | 1 | -0.3 | -0.3 |
| 60 |  Tua TagovailoaATLQB | 1 | -0.6 | -0.6 |
| 61 |  Andy DaltonPHIQB | 1 | -2.0 | -2.0 |
More leaders and tools
Week 8 leaders · 2025 leaders · 2024 leaders · 2023 leaders · 2022 leaders · Projections · Who should I start? · Waiver wire · Over Expected (luck) · Snap counts · Target share · Red zone usage · Fantasy points allowed · DST streamers · Kicker streamers · Trade value
Quarterback data stories
How the game changed, told through the numbers.
- NFL Quarterbacks Are Getting Sacked Like It’s 1999 In the 1960s and ’70s, the league’s old season totals show a little over 8 sacks in every 100 NFL pass plays.
- Is the NFL Backing Away From the Shotgun? In 2007 NFL offenses ran a little over one play in four from the shotgun.
- The Pass Revolution Was Over by 1999 Passes and sacks went from about 42 in every 100 plays in 1977 to 57 in 1995.
How this works
Points come from each regular-season game’s box score, scored in the format you pick (PPR here by default; half PPR, standard, TE premium, 6-point passing TD, DraftKings and FanDuel under the scoring switch). Season pages add up every week so far; week pages show one week. Pts/G divides by games played; L3/G is the average of a player’s last three games in the range.
Snap % and target share count only the games a player played. Opp/G is targets plus carries per game; RZ counts targets and carries inside the opponent’s 20. Defense points allowed leave out points the opponent scored on its own defense or special teams (ESPN and Yahoo rule). Rostered % is the latest daily ESPN snapshot.
Sources: nflverse weekly stats, snap counts and play-by-play, ESPN rostered %Updated Fri, Oct 30, 9:33 AM ET
Frequently asked questions
How are fantasy points calculated?
From each game’s box score: 1 point per 10 rushing or receiving yards, 6 per rushing or receiving touchdown, 1 per 25 passing yards, 4 per passing touchdown, minus 2 per interception or lost fumble, 2 per two-point conversion. PPR adds 1 point per catch, half PPR 0.5 and standard none. Kickers score 3 to 5 per field goal by distance and 1 per extra point; defenses score sacks, takeaways, touchdowns and a points-allowed tier.
Which games count?
Regular-season games only. Week pages show one week; the season boards add up every week so far, and the week-range filter narrows them to any span, for example your fantasy playoff weeks.
Why rank by points per game as well as total?
A player who missed games trails on total points but may score more each week he plays. In our tests (2023 to 2026), ranking by per game changes 1 to 6 names in each position’s top 12 or 24, more than switching between PPR and half PPR does.
What do snap % and opportunity mean?
Snap % is the share of his team’s offensive plays he was on the field for, in the games he played. Opportunity is targets plus carries per game. Through week 7, opportunity predicted the rest of the season about as well as points per game did, so both are shown.
Can I use my league’s scoring?
Yes. Use More for TE premium, 6-point passing touchdowns, DraftKings or FanDuel scoring. Every table re-scores instantly, and your choice is remembered on every Edgehalla tool.