
PPR · 2010 · Final regular season
2010 Fantasy Football Leaders
Every player ranked by 2010 PPR fantasy points, Weeks 1–17, with points per game, last-3 form and usage. Filter by week range, team or games played, or switch scoring.
2010 leaders by position
QB leaders
- 1
 Mike VickPHI310.3
- 2
 Aaron RodgersGB304.5
RB leaders
- 1
 Arian FosterHOU391.8
- 2
 LeSean McCoyPHI297.2
WR leaders
- 1
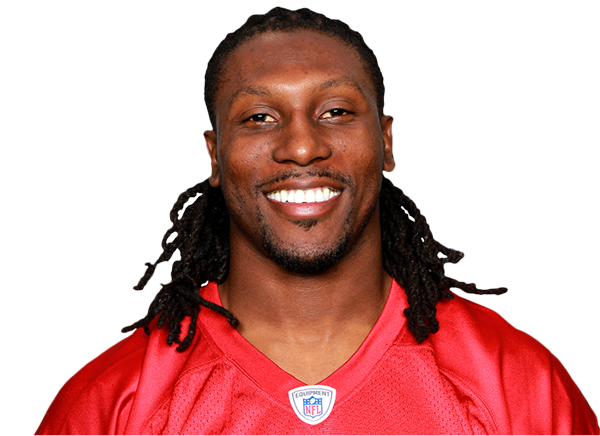 Roddy WhiteATL316.2
- 2
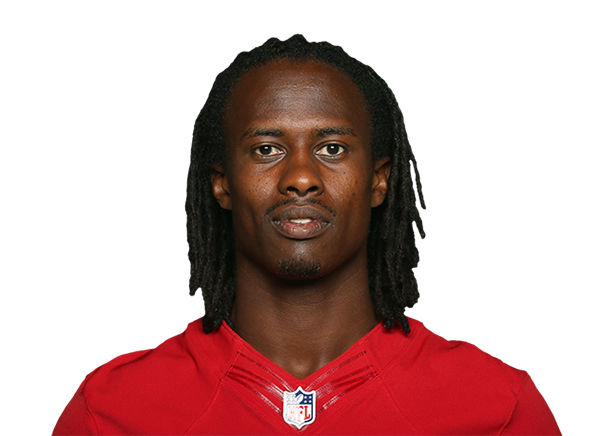 Brandon LloydDEN286.0
TE leaders
- 1
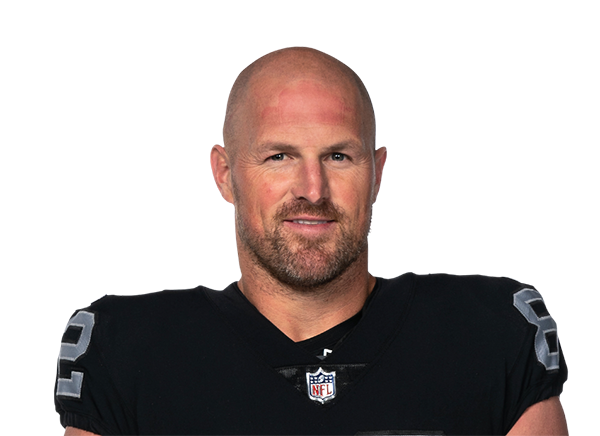 Jason WittenDAL248.2
- 2
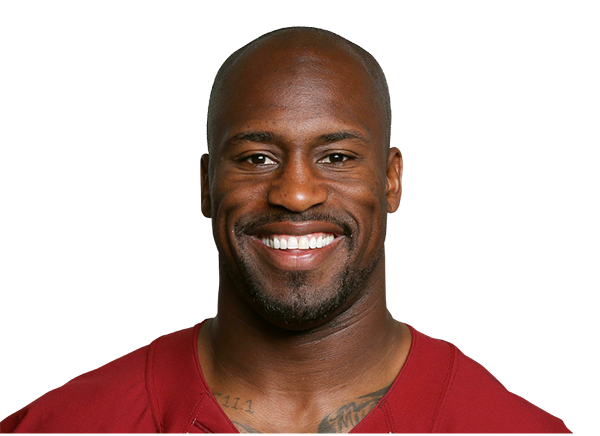 Vernon DavisSF191.4
2010 All positions fantasy points leaders, Weeks 1–17
200 players · 2010 · Weeks 1–17 (top 200 shown in mixed views)
| # | ||||
|---|---|---|---|---|
| 1 | Arian FosterHOURB | 16 | 391.8 | 24.5 |
| 2 | Roddy WhiteATLWR | 16 | 316.2 | 19.8 |
| 3 | Mike VickPHIQB | 12 | 310.3 | 25.9 |
| 4 | Aaron RodgersGBQB | 15 | 304.5 | 20.3 |
| 5 |  Tom BradyNEQB | 16 | 299.0 | 18.7 |
| 6 | LeSean McCoyPHIRB | 15 | 297.2 | 19.8 |
Rows 4–31 continue belowRows 7–31 continue below
Rows 4–31 of 200Rows 7–31 of 200
| # | ||||
|---|---|---|---|---|
| 4 | Aaron RodgersGBQB | 15 | 304.5 | 20.3 |
| 5 | Tom BradyNEQB | 16 | 299.0 | 18.7 |
| 6 | LeSean McCoyPHIRB | 15 | 297.2 | 19.8 |
| 7 |  Peyton HillisCLERB | 16 | 294.9 | 18.4 |
| 8 | Brandon LloydDENWR | 16 | 286.0 | 17.9 |
| 9 |  Peyton ManningINDQB | 16 | 285.8 | 17.9 |
| 10 |  Jamaal CharlesKCRB | 16 | 282.5 | 17.7 |
| 11 |  Philip RiversLACQB | 16 | 281.6 | 17.6 |
| 12 |  Reggie WayneINDWR | 16 | 280.5 | 17.5 |
| 13 |  Dwayne BoweKCWR | 16 | 278.6 | 17.4 |
| 14 |  Ray RiceBALRB | 16 | 276.6 | 17.3 |
| 15 |  Adrian PetersonMINRB | 15 | 275.9 | 18.4 |
| 16 |  Greg JenningsGBWR | 16 | 274.4 | 17.1 |
| 17 |  Chris JohnsonTENRB | 16 | 272.9 | 17.1 |
| 18 |  Drew BreesNOQB | 16 | 270.2 | 16.9 |
| 19 |  Darren McFaddenLVRB | 13 | 267.4 | 20.6 |
| 20 |  Calvin JohnsonDETWR | 15 | 266.2 | 17.7 |
| 21 |  Matt ForteCHIRB | 16 | 264.6 | 16.5 |
| 22 |  Josh FreemanTBQB | 16 | 258.4 | 16.2 |
| 23 |  Andre JohnsonHOUWR | 13 | 256.6 | 19.7 |
| 24 |  Matt RyanATLQB | 16 | 252.4 | 15.8 |
| 25 |  Hakeem NicksNYGWR | 13 | 250.2 | 19.2 |
| 26 |  Mike WallacePITWR | 16 | 249.6 | 15.6 |
| 27 | Jason WittenDALTE | 16 | 248.2 | 15.5 |
| 28 |  Steve JohnsonBUFWR | 16 | 247.3 | 15.5 |
| 29 |  Matt SchaubHOUQB | 16 | 245.6 | 15.3 |
| 30 |  Steven JacksonLARRB | 16 | 242.4 | 15.2 |
| 31 |  Larry FitzgeraldARIWR | 16 | 241.7 | 15.1 |
Rows 32–56 continue below
Rows 32–56 of 200
| # | ||||
|---|---|---|---|---|
| 32 |  Rashard MendenhallPITRB | 16 | 241.0 | 15.1 |
| 33 |  Ahmad BradshawNYGRB | 16 | 239.9 | 15.0 |
| 34 |  Santana MossWASWR | 16 | 235.9 | 14.7 |
| 35 |  Maurice Jones-DrewJAXRB | 14 | 234.1 | 16.7 |
| 36 |  Joe FlaccoBALQB | 16 | 231.3 | 14.5 |
| 37 |  Eli ManningNYGQB | 16 | 231.1 | 14.4 |
| 38 |  Matt CasselKCQB | 15 | 229.1 | 15.3 |
| 39 |  Miles AustinDALWR | 16 | 228.4 | 14.3 |
| 40 |  Marques ColstonNOWR | 15 | 228.4 | 15.2 |
| 41 |  Jeremy MaclinPHIWR | 16 | 228.0 | 14.3 |
| 42 |  Michael TurnerATLRB | 16 | 225.6 | 14.1 |
| 43 |  Terrell OwensCINWR | 13 | 224.3 | 17.3 |
| 44 |  Carson PalmerCINQB | 16 | 223.8 | 14.0 |
| 45 |  Mike WilliamsTBWR | 16 | 223.4 | 14.0 |
| 46 |  David GarrardJAXQB | 14 | 220.4 | 15.7 |
| 47 |  LaDainian TomlinsonNYJRB | 15 | 216.2 | 14.4 |
| 48 |  Wes WelkerNEWR | 15 | 212.8 | 14.2 |
| 49 |  Percy HarvinMINWR | 14 | 212.5 | 15.2 |
| 50 |  Jay CutlerCHIQB | 15 | 210.2 | 14.0 |
| 51 |  Kyle OrtonDENQB | 13 | 209.9 | 16.1 |
| 52 |  Ben RoethlisbergerPITQB | 12 | 209.6 | 17.5 |
| 53 |  DeSean JacksonPHIWR | 14 | 209.0 | 14.9 |
| 54 |  Mario ManninghamNYGWR | 16 | 206.6 | 12.9 |
| 55 |  Brandon MarshallMIAWR | 14 | 203.7 | 14.5 |
| 56 |  Frank GoreSFRB | 11 | 202.5 | 18.4 |
Rows 57–81 continue below
Rows 57–81 of 200
| # | ||||
|---|---|---|---|---|
| 57 |  Mark SanchezNYJQB | 15 | 202.1 | 13.5 |
| 58 |  BenJarvus Green-EllisNERB | 16 | 199.3 | 12.5 |
| 59 |  Ryan FitzpatrickBUFQB | 13 | 198.6 | 15.3 |
| 60 |  Jahvid BestDETRB | 15 | 197.0 | 13.1 |
| 61 |  Cedric BensonCINRB | 16 | 196.9 | 12.3 |
| 62 |  Knowshon MorenoDENRB | 13 | 196.1 | 15.1 |
| 63 |  Davone BessMIAWR | 16 | 191.7 | 12.0 |
| 64 | Vernon DavisSFTE | 16 | 191.4 | 12.0 |
| 65 | 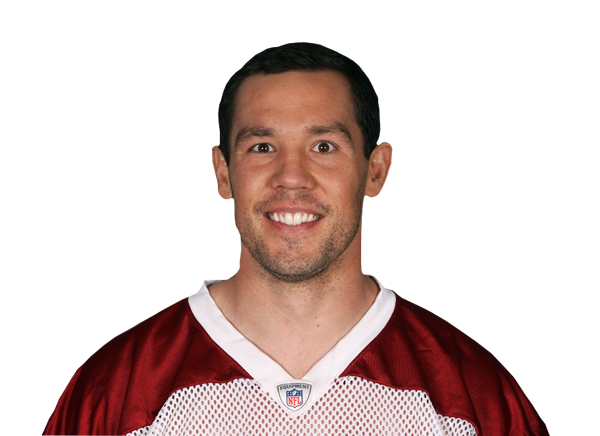 Sam BradfordLARQB | 16 | 190.8 | 11.9 |
| 66 | 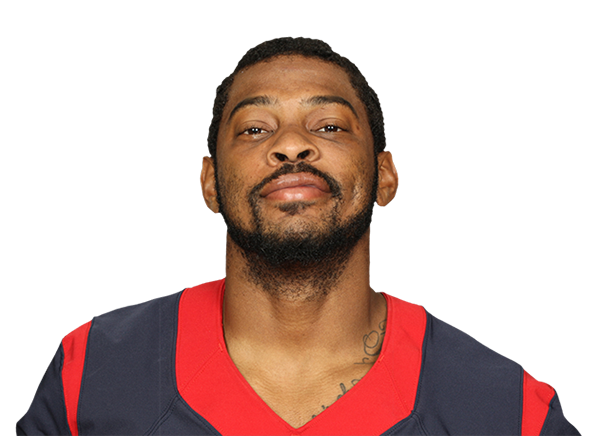 Mike ThomasJAXWR | 16 | 189.4 | 11.8 |
| 67 | 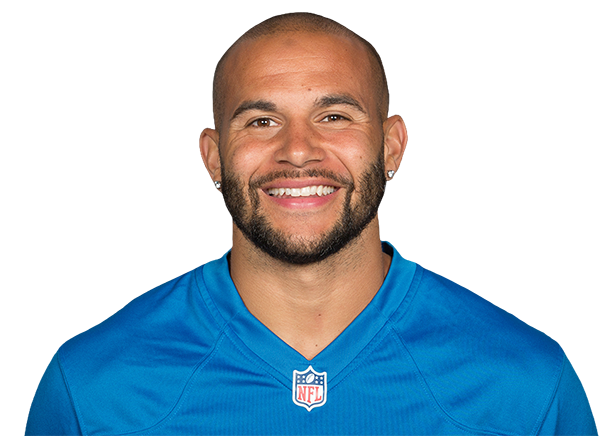 Lance MooreNOWR | 15 | 188.3 | 12.6 |
| 68 |  Antonio GatesLACTE | 10 | 188.2 | 18.8 |
| 69 | 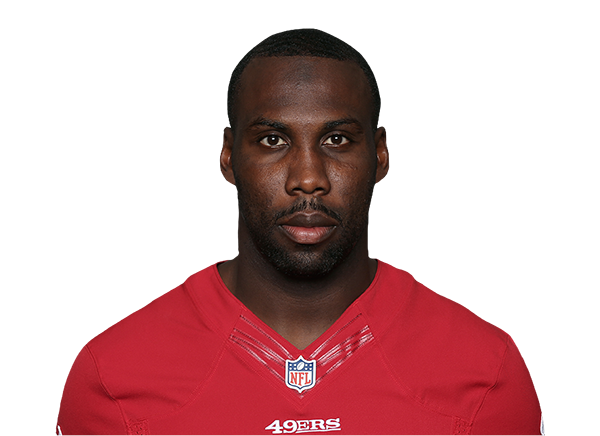 Anquan BoldinBALWR | 16 | 187.7 | 11.7 |
| 70 | 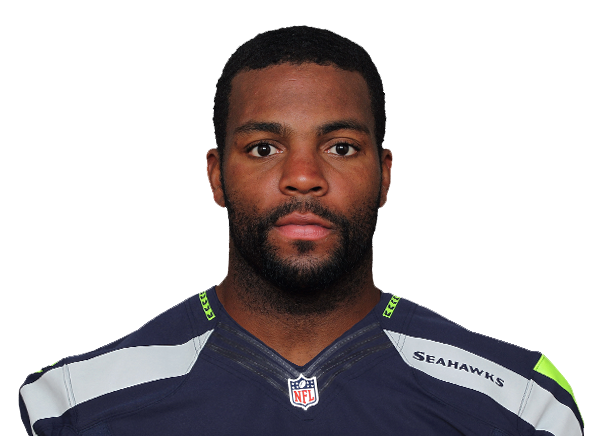 Braylon EdwardsNYJWR | 16 | 185.8 | 11.6 |
| 71 |  Pierre GarconINDWR | 14 | 184.2 | 13.2 |
| 72 | 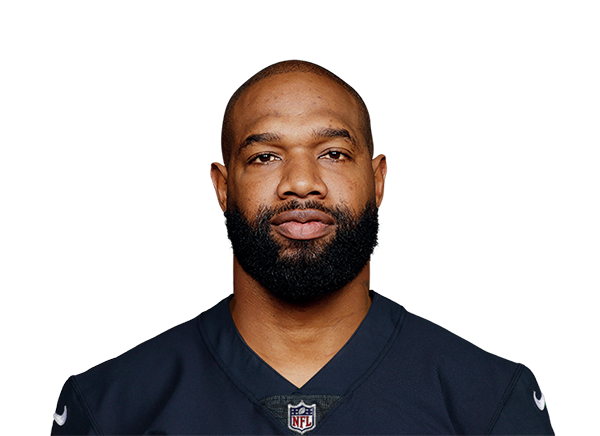 Marcedes LewisJAXTE | 16 | 184.0 | 11.5 |
| 73 |  Derrick MasonBALWR | 16 | 183.2 | 11.4 |
| 74 |  Fred JacksonBUFRB | 16 | 183.2 | 11.4 |
| 75 |  Felix JonesDALRB | 16 | 183.0 | 11.4 |
| 76 |  Mike TolbertLACRB | 15 | 182.1 | 12.1 |
| 77 |  Chris CooleyWASTE | 16 | 179.9 | 11.2 |
| 78 |  Danny AmendolaLARWR | 16 | 178.0 | 11.1 |
| 79 | 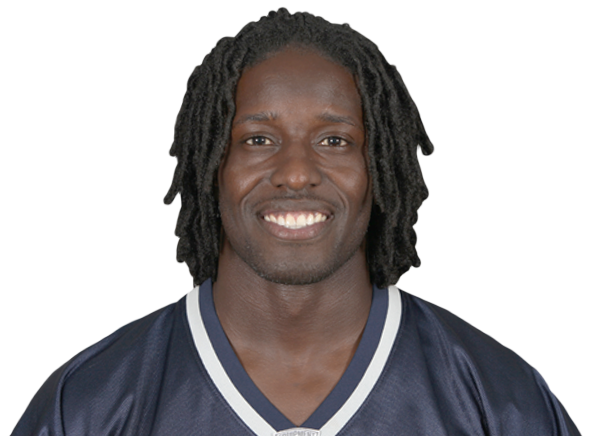 Deion BranchNEWR | 15 | 176.8 | 11.8 |
| 80 | 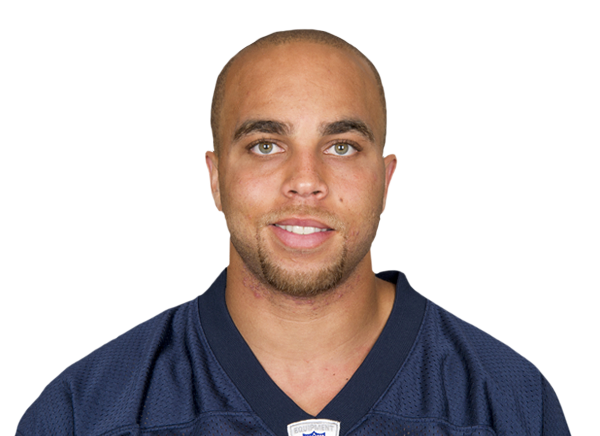 Johnny KnoxCHIWR | 16 | 175.2 | 10.9 |
| 81 | 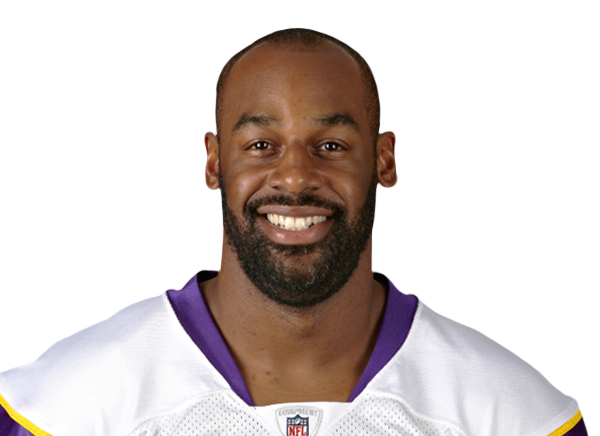 Donovan McNabbWASQB | 13 | 174.2 | 13.4 |
Rows 82–106 continue below
Rows 82–106 of 200
| # | ||||
|---|---|---|---|---|
| 82 | 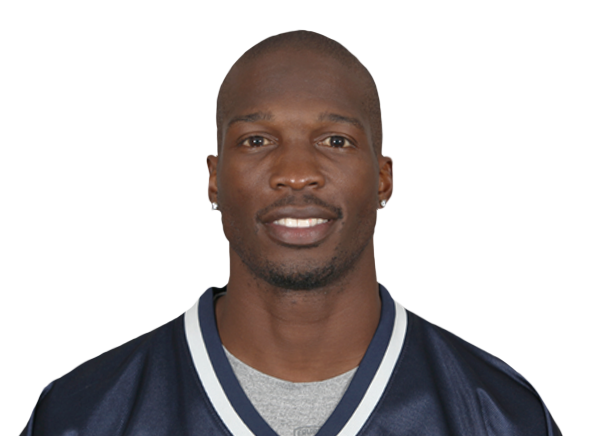 Chad JohnsonCINWR | 14 | 174.1 | 12.4 |
| 83 |  Kenny BrittTENWR | 11 | 173.5 | 15.8 |
| 84 |  Tony GonzalezATLTE | 16 | 171.6 | 10.7 |
| 85 |  Brandon JacksonGBRB | 16 | 171.5 | 10.7 |
| 86 |  Kellen WinslowTBTE | 16 | 169.0 | 10.6 |
| 87 |  Brandon PettigrewDETTE | 16 | 167.2 | 10.4 |
| 88 |  Austin CollieINDWR | 9 | 166.7 | 18.5 |
| 89 | 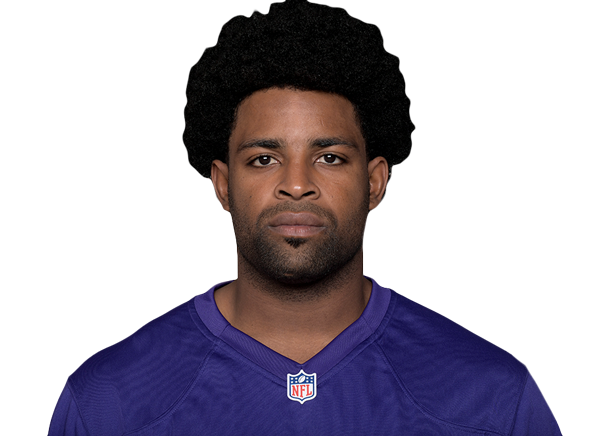 Michael CrabtreeSFWR | 16 | 165.1 | 10.3 |
| 90 | New England Patriots D/STNEDST | 16 | 165.0 | 10.3 |
| 91 |  Jabar GaffneyDENWR | 16 | 164.5 | 10.3 |
| 92 | 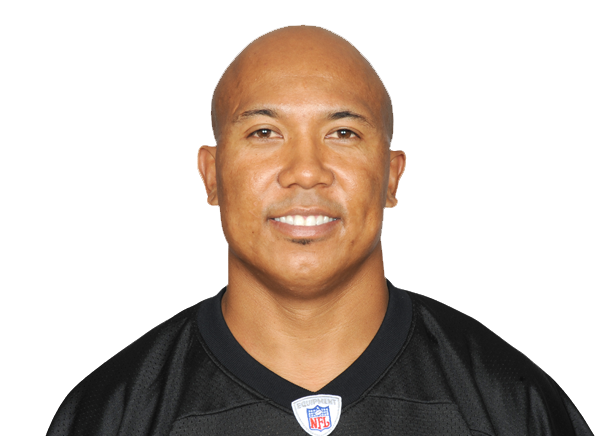 Hines WardPITWR | 16 | 162.3 | 10.1 |
| 93 | 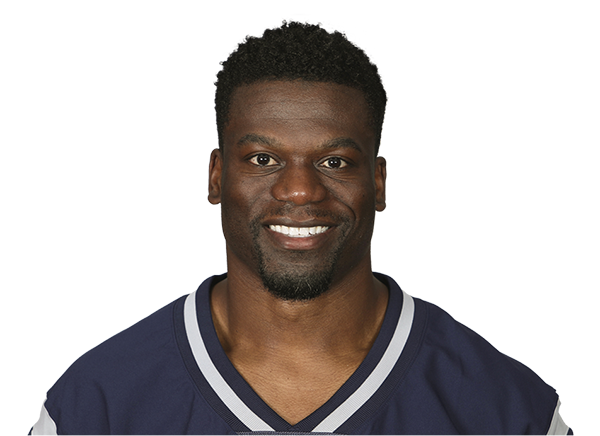 Benjamin WatsonCLETE | 16 | 162.2 | 10.1 |
| 94 |  Danny WoodheadNERB | 15 | 160.6 | 10.7 |
| 95 |  Santonio HolmesNYJWR | 12 | 160.3 | 13.4 |
| 96 |  Shaun HillDETQB | 11 | 159.7 | 14.5 |
| 97 | 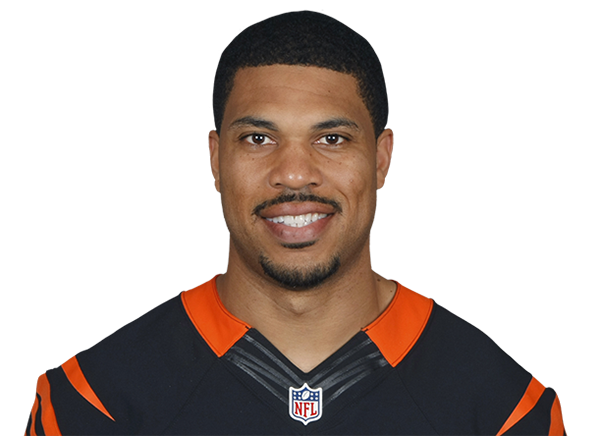 Jason CampbellLVQB | 13 | 158.7 | 12.2 |
| 98 |  Zach MillerLVTE | 15 | 158.5 | 10.6 |
| 99 |  Nate BurlesonDETWR | 14 | 157.6 | 11.3 |
| 100 |  Jon KitnaDALQB | 10 | 157.3 | 15.7 |
| 101 |  Chad HenneMIAQB | 15 | 157.1 | 10.5 |
| 102 |  Ronnie BrownMIARB | 16 | 156.6 | 9.8 |
| 103 |  Rob GronkowskiNETE | 16 | 154.6 | 9.7 |
| 104 |  Jacob TammeINDTE | 13 | 154.1 | 11.9 |
| 105 | Arizona Cardinals D/STARIDST | 16 | 154.0 | 9.6 |
| 106 |  Dustin KellerNYJTE | 15 | 153.7 | 10.2 |
Rows 107–131 continue below
Rows 107–131 of 200
| # | ||||
|---|---|---|---|---|
| 107 |  Mike WilliamsSEAWR | 13 | 152.1 | 11.7 |
| 108 |  Michael BushLVRB | 14 | 150.9 | 10.8 |
| 109 |  Sebastian JanikowskiLVK | 16 | 150.0 | 9.4 |
| 110 |  Thomas JonesKCRB | 16 | 149.8 | 9.4 |
| 111 |  Dez BryantDALWR | 12 | 149.1 | 12.4 |
| 112 |  David AkersPHIK | 16 | 149.0 | 9.3 |
| 113 |  Darren SprolesLACRB | 16 | 148.0 | 9.3 |
| 114 |  Matt HasselbeckSEAQB | 14 | 147.9 | 10.6 |
| 115 |  Anthony ArmstrongWASWR | 15 | 147.1 | 9.8 |
| 116 |  Nate WashingtonTENWR | 16 | 145.9 | 9.1 |
| 117 |  James JonesGBWR | 16 | 145.9 | 9.1 |
| 118 |  Brandon JacobsNYGRB | 16 | 145.2 | 9.1 |
| 119 |  Malcom FloydLACWR | 11 | 144.7 | 13.2 |
| 120 |  Eddie RoyalDENWR | 16 | 143.8 | 9.0 |
| 121 |  Kevin WalterHOUWR | 14 | 143.1 | 10.2 |
| 122 |  Aaron HernandezNETE | 14 | 142.0 | 10.1 |
| 123 |  Cadillac WilliamsTBRB | 16 | 141.2 | 8.8 |
| 124 |  Ryan MathewsLACRB | 12 | 140.0 | 11.7 |
| 125 | Oakland Raiders D/STLVDST | 16 | 140.0 | 8.8 |
| 126 |  Robert MeachemNOWR | 16 | 139.2 | 8.7 |
| 127 |  Mike Sims-WalkerJAXWR | 14 | 139.2 | 9.9 |
| 128 |  Ryan TorainWASRB | 10 | 138.7 | 13.9 |
| 129 |  Marshawn LynchSEARB | 16 | 138.2 | 8.6 |
| 130 | 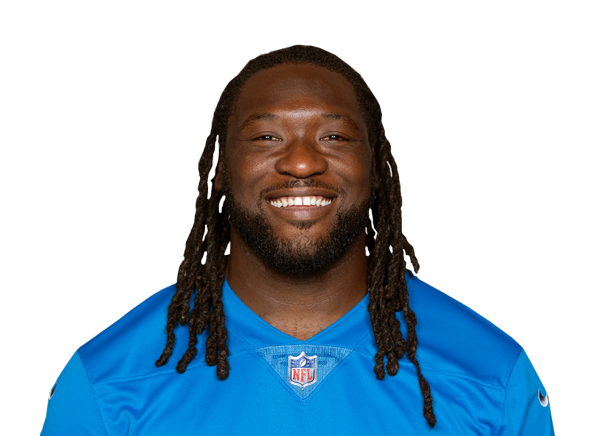 LeGarrette BlountTBRB | 13 | 137.1 | 10.5 |
| 131 | 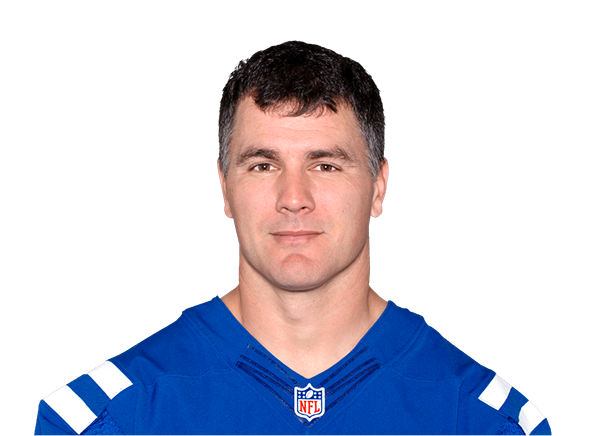 Adam VinatieriINDK | 16 | 137.0 | 8.6 |
Rows 132–156 continue below
Rows 132–156 of 200
| # | ||||
|---|---|---|---|---|
| 132 | 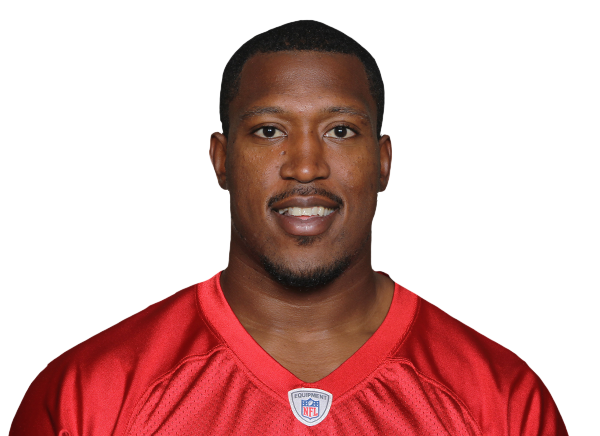 Jason SnellingATLRB | 14 | 136.7 | 9.8 |
| 133 |  Matt BryantATLK | 16 | 136.0 | 8.5 |
| 134 | Pittsburgh Steelers D/STPITDST | 16 | 136.0 | 8.5 |
| 135 | 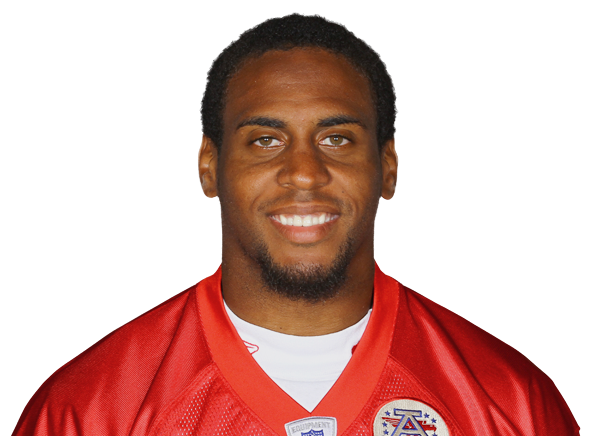 Steve BreastonARIWR | 13 | 135.0 | 10.4 |
| 136 |  Alex SmithSFQB | 11 | 134.8 | 12.3 |
| 137 | Dallas Cowboys D/STDALDST | 16 | 134.0 | 8.4 |
| 138 |  Josh BrownLARK | 16 | 133.0 | 8.3 |
| 139 |  Devin HesterCHIWR | 16 | 132.5 | 8.3 |
| 140 |  Neil RackersHOUK | 16 | 132.0 | 8.3 |
| 141 | New York Jets D/STNYJDST | 16 | 131.0 | 8.2 |
| 142 |  Tim HightowerARIRB | 16 | 130.2 | 8.1 |
| 143 |  Mike GoodsonCARRB | 16 | 130.2 | 8.1 |
| 144 |  Jordan ShipleyCINWR | 15 | 130.0 | 8.7 |
| 145 |  Todd HeapBALTE | 13 | 129.9 | 10.0 |
| 146 |  Brandon GibsonLARWR | 14 | 129.8 | 9.3 |
| 147 |  Donald DriverGBWR | 15 | 129.5 | 8.6 |
| 148 |  Jacoby FordLVWR | 15 | 129.5 | 8.6 |
| 149 | Green Bay Packers D/STGBDST | 16 | 129.0 | 8.1 |
| 150 |  Jacoby JonesHOUWR | 15 | 127.9 | 8.5 |
| 151 | Chicago Bears D/STCHIDST | 16 | 127.0 | 7.9 |
| 152 |  Nick FolkNYJK | 16 | 126.0 | 7.9 |
| 153 |  Josh MorganSFWR | 16 | 125.5 | 7.8 |
| 154 |  Dan CarpenterMIAK | 16 | 125.0 | 7.8 |
| 155 |  Keiland WilliamsWASRB | 14 | 124.0 | 8.9 |
| 156 | Detroit Lions D/STDETDST | 16 | 124.0 | 7.8 |
Rows 157–181 continue below
Rows 157–181 of 200
| # | ||||
|---|---|---|---|---|
| 157 |  Jermaine GreshamCINTE | 15 | 123.1 | 8.2 |
| 158 | New York Giants D/STNYGDST | 16 | 123.0 | 7.7 |
| 159 |  Justin ForsettSEARB | 16 | 122.2 | 7.6 |
| 160 |  Earl BennettCHIWR | 14 | 121.0 | 8.6 |
| 161 |  Billy CundiffBALK | 16 | 121.0 | 7.6 |
| 162 |  David BuehlerDALK | 16 | 121.0 | 7.6 |
| 163 |  Tony MoeakiKCTE | 15 | 120.6 | 8.0 |
| 164 |  Rob BironasTENK | 16 | 120.0 | 7.5 |
| 165 |  Mason CrosbyGBK | 16 | 120.0 | 7.5 |
| 166 | Seattle Seahawks D/STSEADST | 16 | 120.0 | 7.5 |
| 167 | Philadelphia Eagles D/STPHIDST | 16 | 119.0 | 7.4 |
| 168 | 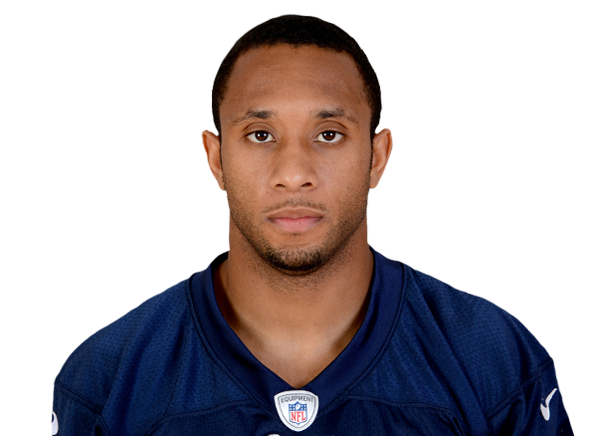 Steve SmithNYGWR | 9 | 118.9 | 13.2 |
| 169 | 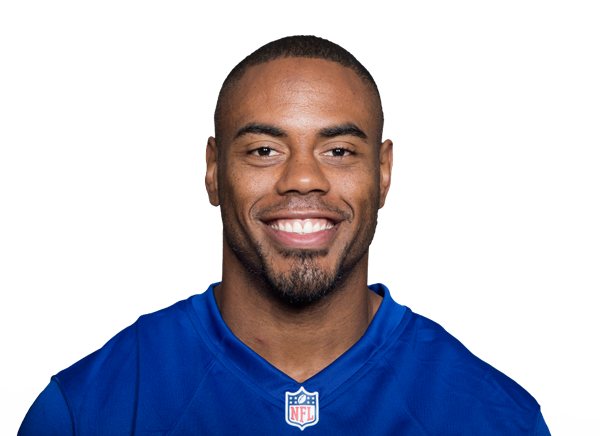 Rashad JenningsJAXRB | 12 | 118.2 | 9.8 |
| 170 |  Roy WilliamsDALWR | 15 | 118.0 | 7.9 |
| 171 | Atlanta Falcons D/STATLDST | 16 | 118.0 | 7.4 |
| 172 |  Brent CelekPHITE | 14 | 117.1 | 8.4 |
| 173 | 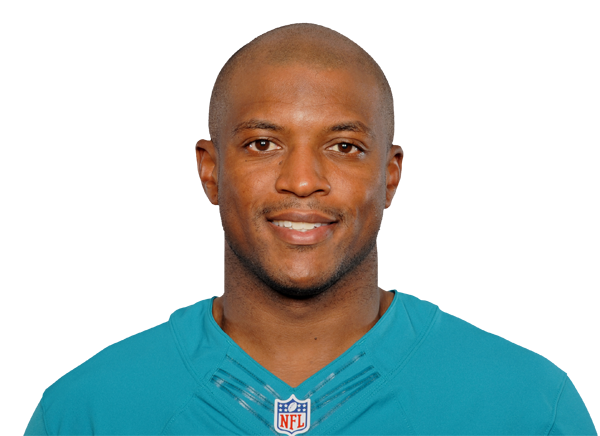 Lee EvansBUFWR | 13 | 116.8 | 9.0 |
| 174 |  Jay FeelyARIK | 16 | 116.5 | 7.3 |
| 175 |  Jason AvantPHIWR | 16 | 116.3 | 7.3 |
| 176 |  Louis MurphyLVWR | 14 | 116.2 | 8.3 |
| 177 |  Kevin BossNYGTE | 15 | 116.1 | 7.7 |
| 178 |  Nate KaedingLACK | 13 | 116.0 | 8.9 |
| 179 |  Anthony FasanoMIATE | 15 | 115.8 | 7.7 |
| 180 |  Josh ScobeeJAXK | 16 | 115.0 | 7.2 |
| 181 |  Robbie GouldCHIK | 16 | 115.0 | 7.2 |
Rows 182–200 continue below
Rows 182–200 of 200
| # | ||||
|---|---|---|---|---|
| 182 |  Ricky WilliamsMIARB | 16 | 114.4 | 7.2 |
| 183 |  Jordy NelsonGBWR | 16 | 113.2 | 7.1 |
| 184 |  Shonn GreeneNYJRB | 15 | 112.6 | 7.5 |
| 185 |  Visanthe ShiancoeMINTE | 16 | 112.0 | 7.0 |
| 186 |  Brian HartlineMIAWR | 12 | 111.2 | 9.3 |
| 187 | Tennessee Titans D/STTENDST | 16 | 111.0 | 6.9 |
| 188 |  Steve SmithCARWR | 14 | 110.3 | 7.9 |
| 189 |  Connor BarthTBK | 16 | 110.0 | 6.9 |
| 190 |  Joel DreessenHOUTE | 16 | 109.8 | 6.9 |
| 191 |  Greg OlsenCHITE | 16 | 109.4 | 6.8 |
| 192 |  Ben ObomanuSEAWR | 13 | 109.1 | 8.4 |
| 193 |  Kerry CollinsTENQB | 10 | 109.0 | 10.9 |
| 194 |  Olindo MareSEAK | 16 | 108.0 | 6.8 |
| 195 | San Francisco 49ers D/STSFDST | 16 | 107.0 | 6.7 |
| 196 |  David GettisCARWR | 15 | 106.0 | 7.1 |
| 197 | San Diego Chargers D/STLACDST | 16 | 106.0 | 6.6 |
| 198 |  Maurice MorrisDETRB | 13 | 105.6 | 8.1 |
| 199 |  Jonathan StewartCARRB | 14 | 105.3 | 7.5 |
| 200 |  John KasayCARK | 16 | 105.0 | 6.6 |
More leaders and tools
Week 17 leaders · 2026 leaders · 2025 leaders · 2024 leaders · 2023 leaders · Projections · Who should I start? · Waiver wire · Over Expected (luck) · Snap counts · Target share · Red zone usage · Fantasy points allowed · DST streamers · Kicker streamers · Trade value
Fantasy football data stories
How the game changed, told through the numbers.
- The Running-Back Cliff Barely Moved. Fewer Backs Reach It. In 2003, backs aged 28 or older got a third of NFL running-back carries.
- The Workhorse Running Back Is Back, but Only to the Late 2010s In the early 2000s the average NFL lead back got about 66 of every 100 running-back carries.
- The Kickoff Return Came Back. The Touchdowns Didn’t. For 13 years NFL rules pushed kickoffs into the end zone, and by 2023 only about one in five was returned.
How this works
Points come from each regular-season game’s box score, scored in the format you pick (PPR here by default; half PPR, standard, TE premium, 6-point passing TD, DraftKings and FanDuel under the scoring switch). Season pages add up every week so far; week pages show one week. Pts/G divides by games played; L3/G is the average of a player’s last three games in the range.
Snap % and target share count only the games a player played. Opp/G is targets plus carries per game; RZ counts targets and carries inside the opponent’s 20. Defense points allowed leave out points the opponent scored on its own defense or special teams (ESPN and Yahoo rule). Rostered % is the latest daily ESPN snapshot.
Sources: nflverse weekly stats, snap counts and play-by-playUpdated Fri, Oct 30, 12:40 PM ET
Frequently asked questions
How are fantasy points calculated?
From each game’s box score: 1 point per 10 rushing or receiving yards, 6 per rushing or receiving touchdown, 1 per 25 passing yards, 4 per passing touchdown, minus 2 per interception or lost fumble, 2 per two-point conversion. PPR adds 1 point per catch, half PPR 0.5 and standard none. Kickers score 3 to 5 per field goal by distance and 1 per extra point; defenses score sacks, takeaways, touchdowns and a points-allowed tier.
Which games count?
Regular-season games only. Week pages show one week; the season boards add up every week so far, and the week-range filter narrows them to any span, for example your fantasy playoff weeks.
Why rank by points per game as well as total?
A player who missed games trails on total points but may score more each week he plays. In our tests (2023 to 2026), ranking by per game changes 1 to 6 names in each position’s top 12 or 24, more than switching between PPR and half PPR does.
What do snap % and opportunity mean?
Snap % is the share of his team’s offensive plays he was on the field for, in the games he played. Opportunity is targets plus carries per game. Through week 7, opportunity predicted the rest of the season about as well as points per game did, so both are shown.
Can I use my league’s scoring?
Yes. Use More for TE premium, 6-point passing touchdowns, DraftKings or FanDuel scoring. Every table re-scores instantly, and your choice is remembered on every Edgehalla tool.