
Half PPR · 2001 · Final regular season
2001 Fantasy Football Leaders
Every player ranked by 2001 Half PPR fantasy points, Weeks 1–17, with points per game, last-3 form and usage. Filter by week range, team or games played, or switch scoring.
2001 leaders by position
QB leaders
- 1
 Jeff GarciaSF296.9
- 2
 Kurt WarnerLAR293.2
RB leaders
- 1
 Marshall FaulkLAR378.2
- 2
 Priest HolmesKC301.9
WR leaders
- 1
 Marvin HarrisonIND297.2
- 2
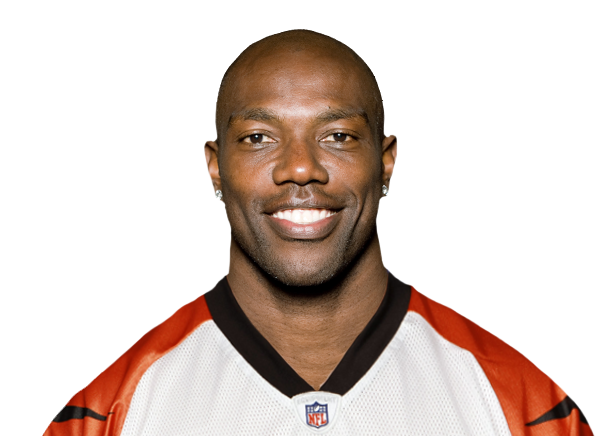 Terrell OwensSF285.8
TE leaders
- 1
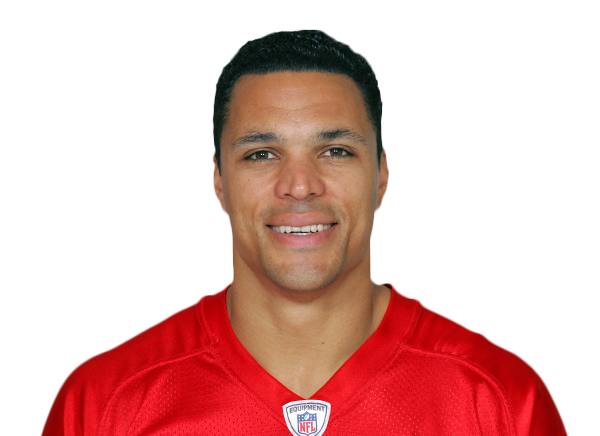 Tony GonzalezKC168.7
- 2
 Marcus PollardIND145.4
2001 All positions fantasy points leaders, Weeks 1–17
200 players · 2001 · Weeks 1–17 (top 200 shown in mixed views)
| # | ||||
|---|---|---|---|---|
| 1 | Marshall FaulkLARRB | 14 | 378.2 | 27.0 |
| 2 | Priest HolmesKCRB | 16 | 301.9 | 18.9 |
| 3 | Marvin HarrisonINDWR | 16 | 297.2 | 18.6 |
| 4 | Jeff GarciaSFQB | 16 | 296.9 | 18.6 |
| 5 | Kurt WarnerLARQB | 16 | 293.2 | 18.3 |
| 6 |  Ahman GreenGBRB | 16 | 287.1 | 17.9 |
Rows 4–31 continue belowRows 7–31 continue below
Rows 4–31 of 200Rows 7–31 of 200
| # | ||||
|---|---|---|---|---|
| 4 | Jeff GarciaSFQB | 16 | 296.9 | 18.6 |
| 5 | Kurt WarnerLARQB | 16 | 293.2 | 18.3 |
| 6 | Ahman GreenGBRB | 16 | 287.1 | 17.9 |
| 7 | Terrell OwensSFWR | 16 | 285.8 | 17.9 |
| 8 |  Shaun AlexanderSEARB | 16 | 276.1 | 17.3 |
| 9 |  Curtis MartinNYJRB | 16 | 270.5 | 16.9 |
| 10 |  Rich GannonLVQB | 16 | 266.2 | 16.6 |
| 11 |  Steve McNairTENQB | 15 | 265.4 | 17.7 |
| 12 |  Rod SmithDENWR | 15 | 261.5 | 17.4 |
| 13 | 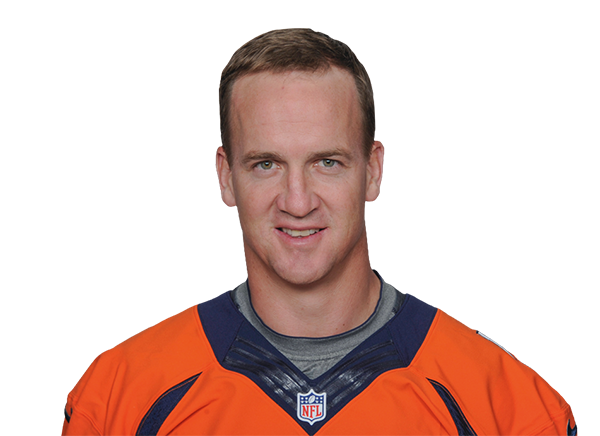 Peyton ManningINDQB | 16 | 260.9 | 16.3 |
| 14 | 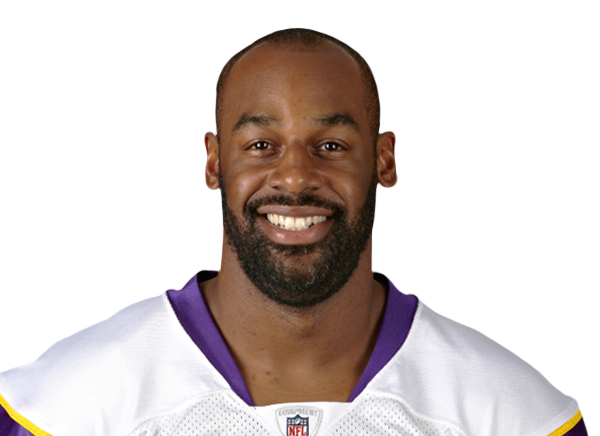 Donovan McNabbPHIQB | 15 | 259.5 | 17.3 |
| 15 |  Brett FavreGBQB | 16 | 258.4 | 16.2 |
| 16 |  David BostonARIWR | 16 | 258.3 | 16.1 |
| 17 |  Aaron BrooksNOQB | 16 | 253.1 | 15.8 |
| 18 |  Corey DillonCINRB | 16 | 241.3 | 15.1 |
| 19 |  Jimmy SmithJAXWR | 16 | 241.0 | 15.1 |
| 20 |  LaDainian TomlinsonLACRB | 16 | 239.8 | 15.0 |
| 21 |  Ricky WilliamsNORB | 16 | 235.6 | 14.7 |
| 22 |  Kordell StewartPITQB | 16 | 234.1 | 14.6 |
| 23 |  Randy MossMINWR | 16 | 229.3 | 14.3 |
| 24 |  Tim BrownLVWR | 16 | 225.9 | 14.1 |
| 25 |  Troy BrownNEWR | 16 | 221.5 | 13.8 |
| 26 |  Joe HornNOWR | 16 | 220.4 | 13.8 |
| 27 |  Jay FiedlerMIAQB | 16 | 220.0 | 13.8 |
| 28 |  Torry HoltLARWR | 16 | 218.8 | 13.7 |
| 29 |  Antowain SmithNERB | 16 | 214.4 | 13.4 |
| 30 |  Derrick MasonTENWR | 15 | 211.3 | 14.1 |
| 31 |  Jerry RiceLVWR | 16 | 209.4 | 13.1 |
Rows 32–56 continue below
Rows 32–56 of 200
| # | ||||
|---|---|---|---|---|
| 32 |  Marty BookerCHIWR | 16 | 209.3 | 13.1 |
| 33 |  Mark BrunellJAXQB | 15 | 206.8 | 13.8 |
| 34 |  Kevin JohnsonCLEWR | 16 | 205.7 | 12.9 |
| 35 |  Tiki BarberNYGRB | 14 | 204.2 | 14.6 |
| 36 |  Garrison HearstSFRB | 16 | 203.8 | 12.7 |
| 37 |  Stephen DavisWASRB | 16 | 203.7 | 12.7 |
| 38 |  Jake PlummerARIQB | 16 | 202.4 | 12.7 |
| 39 |  Curtis ConwayLACWR | 16 | 199.6 | 12.5 |
| 40 |  Daunte CulpepperMINQB | 11 | 198.6 | 18.1 |
| 41 |  Dominic RhodesINDRB | 15 | 197.8 | 13.2 |
| 42 |  Brad JohnsonTBQB | 16 | 196.2 | 12.3 |
| 43 |  Keenan McCardellJAXWR | 16 | 193.5 | 12.1 |
| 44 |  Brian GrieseDENQB | 15 | 192.3 | 12.8 |
| 45 |  Darrell JacksonSEAWR | 16 | 192.0 | 12.0 |
| 46 |  Charlie GarnerLVRB | 16 | 191.7 | 12.0 |
| 47 |  Anthony ThomasCHIRB | 14 | 191.1 | 13.7 |
| 48 |  Kerry CollinsNYGQB | 16 | 190.2 | 11.9 |
| 49 |  Trent GreenKCQB | 16 | 185.7 | 11.6 |
| 50 |  Qadry IsmailBALWR | 16 | 184.9 | 11.6 |
| 51 |  Doug FlutieLACQB | 16 | 183.8 | 11.5 |
| 52 |  Keyshawn JohnsonTBWR | 15 | 183.6 | 12.2 |
| 53 |  Hines WardPITWR | 16 | 177.6 | 11.1 |
| 54 |  Willie JacksonNOWR | 16 | 177.1 | 11.1 |
| 55 |  Isaac BruceLARWR | 16 | 176.9 | 11.1 |
| 56 |  Johnnie MortonDETWR | 16 | 176.5 | 11.0 |
Rows 57–81 continue below
Rows 57–81 of 200
| # | ||||
|---|---|---|---|---|
| 57 |  Duce StaleyPHIRB | 13 | 176.5 | 13.6 |
| 58 |  Mike AlstottTBRB | 16 | 174.6 | 10.9 |
| 59 |  Stacey MackJAXRB | 16 | 173.7 | 10.9 |
| 60 |  Lamar SmithMIARB | 16 | 173.2 | 10.8 |
| 61 |  Bill SchroederGBWR | 14 | 172.9 | 12.3 |
| 62 |  Amani ToomerNYGWR | 16 | 172.2 | 10.8 |
| 63 | 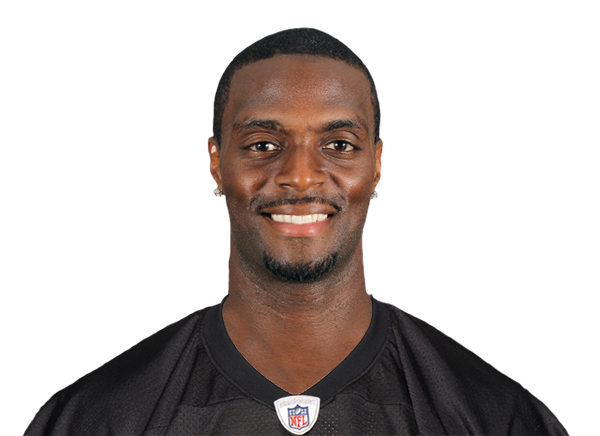 Plaxico BurressPITWR | 16 | 169.8 | 10.6 |
| 64 | 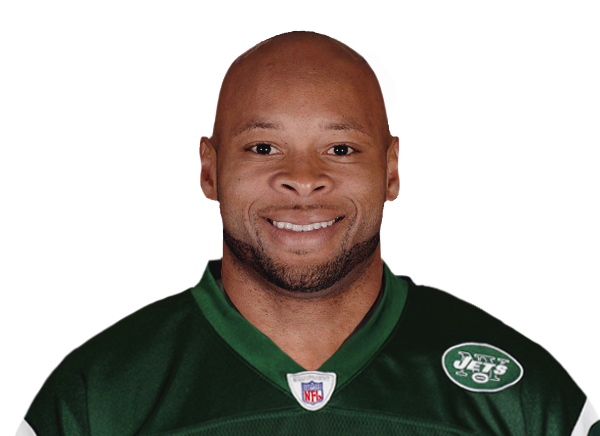 Laveranues ColesNYJWR | 16 | 169.1 | 10.6 |
| 65 | Tony GonzalezKCTE | 16 | 168.7 | 10.5 |
| 66 |  Peerless PriceBUFWR | 16 | 168.7 | 10.5 |
| 67 |  James ThrashPHIWR | 15 | 166.5 | 11.1 |
| 68 |  Warrick DunnTBRB | 13 | 166.4 | 12.8 |
| 69 |  Chris WeinkeCARQB | 15 | 166.0 | 11.1 |
| 70 | 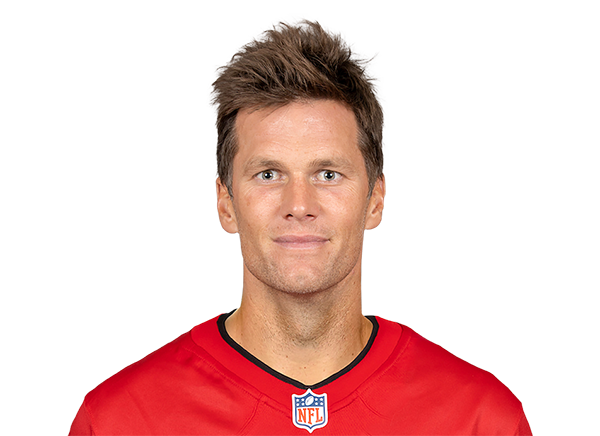 Tom BradyNEQB | 15 | 162.8 | 10.9 |
| 71 | Cleveland Browns D/STCLEDST | 16 | 160.0 | 10.0 |
| 72 |  Eddie GeorgeTENRB | 16 | 158.3 | 9.9 |
| 73 |  Chris ChandlerATLQB | 14 | 158.3 | 11.3 |
| 74 |  Michael PittmanARIRB | 15 | 158.0 | 10.5 |
| 75 |  Cris CarterMINWR | 16 | 156.0 | 9.8 |
| 76 |  Eric MouldsBUFWR | 16 | 154.2 | 9.6 |
| 77 | New England Patriots D/STNEDST | 16 | 154.0 | 9.6 |
| 78 | Pittsburgh Steelers D/STPITDST | 16 | 154.0 | 9.6 |
| 79 |  Tim CouchCLEQB | 16 | 153.9 | 9.6 |
| 80 |  Kevin DysonTENWR | 16 | 153.5 | 9.6 |
| 81 | 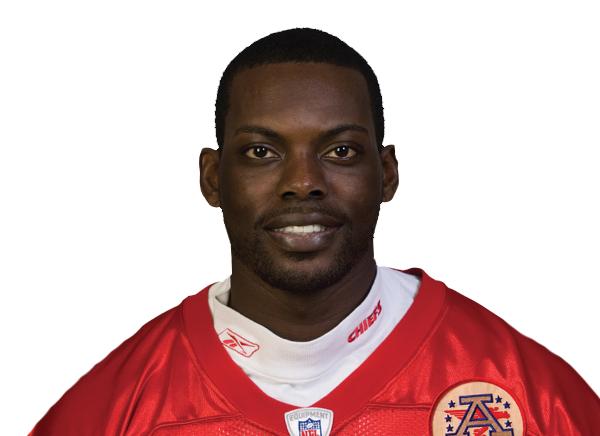 Chris ChambersMIAWR | 16 | 153.2 | 9.6 |
Rows 82–106 continue below
Rows 82–106 of 200
| # | ||||
|---|---|---|---|---|
| 82 | Chicago Bears D/STCHIDST | 16 | 153.0 | 9.6 |
| 83 | Green Bay Packers D/STGBDST | 16 | 153.0 | 9.6 |
| 84 | New York Jets D/STNYJDST | 16 | 146.0 | 9.1 |
| 85 | Marcus PollardINDTE | 16 | 145.4 | 9.1 |
| 86 |  Antonio FreemanGBWR | 16 | 145.3 | 9.1 |
| 87 |  Jerome BettisPITRB | 11 | 145.3 | 13.2 |
| 88 |  Jamel WhiteCLERB | 16 | 144.1 | 9.0 |
| 89 |  Elvis GrbacBALQB | 14 | 143.1 | 10.2 |
| 90 | Tampa Bay Buccaneers D/STTBDST | 16 | 143.0 | 8.9 |
| 91 |  Maurice SmithATLRB | 15 | 142.5 | 9.5 |
| 92 |  David PattenNEWR | 15 | 141.5 | 9.4 |
| 93 |  Vinny TestaverdeNYJQB | 16 | 140.6 | 8.8 |
| 94 |  Larry CentersBUFRB | 16 | 140.0 | 8.8 |
| 95 | San Diego Chargers D/STLACDST | 16 | 140.0 | 8.8 |
| 96 | Philadelphia Eagles D/STPHIDST | 16 | 140.0 | 8.8 |
| 97 |  Jon KitnaCINQB | 16 | 139.9 | 8.7 |
| 98 |  Emmitt SmithDALRB | 14 | 138.2 | 9.9 |
| 99 |  Mike VanderjagtINDK | 16 | 138.0 | 8.6 |
| 100 | St. Louis Rams D/STLARDST | 16 | 138.0 | 8.6 |
| 101 |  Tony BanksWASQB | 15 | 136.6 | 9.1 |
| 102 |  Jeff GrahamLACWR | 14 | 135.1 | 9.7 |
| 103 | Cincinnati Bengals D/STCINDST | 16 | 135.0 | 8.4 |
| 104 |  Jason ElamDENK | 16 | 134.0 | 8.4 |
| 105 |  Ike HilliardNYGWR | 14 | 130.0 | 9.3 |
| 106 |  Jeff WilkinsLARK | 16 | 129.0 | 8.1 |
Rows 107–131 continue below
Rows 107–131 of 200
| # | ||||
|---|---|---|---|---|
| 107 |  Shannon SharpeBALTE | 16 | 127.6 | 8.0 |
| 108 |  J.J. StokesSFWR | 16 | 127.5 | 8.0 |
| 109 | Baltimore Ravens D/STBALDST | 16 | 126.0 | 7.9 |
| 110 | Miami Dolphins D/STMIADST | 16 | 126.0 | 7.9 |
| 111 |  Raghib IsmailDALWR | 14 | 125.0 | 8.9 |
| 112 |  Michael BennettMINRB | 13 | 123.3 | 9.5 |
| 113 | Carolina Panthers D/STCARDST | 16 | 123.0 | 7.7 |
| 114 |  Darnay ScottCINWR | 16 | 122.4 | 7.7 |
| 115 |  Frank WycheckTENTE | 16 | 122.1 | 7.6 |
| 116 | Denver Broncos D/STDENDST | 16 | 122.0 | 7.6 |
| 117 |  Travis HenryBUFRB | 13 | 121.8 | 9.4 |
| 118 |  Ron DayneNYGRB | 16 | 121.7 | 7.6 |
| 119 |  David AkersPHIK | 16 | 121.0 | 7.6 |
| 120 |  John CarneyNOK | 15 | 120.9 | 8.1 |
| 121 |  Rod GardnerWASWR | 16 | 120.7 | 7.5 |
| 122 |  Paul EdingerCHIK | 16 | 120.0 | 7.5 |
| 123 | Oakland Raiders D/STLVDST | 16 | 120.0 | 7.5 |
| 124 |  Michael WestbrookWASWR | 16 | 119.7 | 7.5 |
| 125 |  Charlie BatchDETQB | 10 | 118.2 | 11.8 |
| 126 |  Kris BrownPITK | 16 | 117.6 | 7.3 |
| 127 |  Joey GallowayDALWR | 16 | 117.1 | 7.3 |
| 128 | San Francisco 49ers D/STSFDST | 16 | 117.0 | 7.3 |
| 129 |  Kevan BarlowSFRB | 15 | 116.9 | 7.8 |
| 130 |  Jay FeelyATLK | 16 | 116.3 | 7.3 |
| 131 |  James StewartDETRB | 11 | 116.2 | 10.6 |
Rows 132–156 continue below
Rows 132–156 of 200
| # | ||||
|---|---|---|---|---|
| 132 |  Jim MillerCHIQB | 14 | 116.1 | 8.3 |
| 133 |  Adam VinatieriNEK | 16 | 116.0 | 7.3 |
| 134 | New Orleans Saints D/STNODST | 16 | 116.0 | 7.3 |
| 135 |  Matt StoverBALK | 16 | 115.0 | 7.2 |
| 136 |  Sebastian JanikowskiLVK | 15 | 115.0 | 7.7 |
| 137 |  Bob ChristianATLRB | 16 | 114.1 | 7.1 |
| 138 |  Desmond ClarkDENTE | 15 | 114.1 | 7.6 |
| 139 |  Joe JureviciusNYGWR | 14 | 114.1 | 8.2 |
| 140 |  James McKnightMIAWR | 16 | 113.8 | 7.1 |
| 141 |  Edgerrin JamesINDRB | 6 | 113.5 | 18.9 |
| 142 | Indianapolis Colts D/STINDDST | 16 | 113.0 | 7.1 |
| 143 | Seattle Seahawks D/STSEADST | 16 | 113.0 | 7.1 |
| 144 |  Alex Van PeltBUFQB | 12 | 111.5 | 9.3 |
| 145 |  Byron ChamberlainMINTE | 16 | 111.1 | 6.9 |
| 146 |  John HallNYJK | 16 | 111.0 | 6.9 |
| 147 | New York Giants D/STNYGDST | 16 | 111.0 | 6.9 |
| 148 |  Oronde GadsdenMIAWR | 14 | 110.9 | 7.9 |
| 149 |  Todd PetersonKCK | 16 | 110.0 | 6.9 |
| 150 |  Wayne ChrebetNYJWR | 15 | 109.0 | 7.3 |
| 151 |  Ricky ProehlLARWR | 14 | 108.8 | 7.8 |
| 152 |  Cory SchlesingerDETRB | 16 | 108.0 | 6.8 |
| 153 |  Peter WarrickCINWR | 16 | 107.1 | 6.7 |
| 154 | Tennessee Titans D/STTENDST | 16 | 107.0 | 6.7 |
| 155 |  Brett ConwayWASK | 16 | 105.0 | 6.6 |
| 156 |  Bubba FranksGBTE | 15 | 104.2 | 6.9 |
Rows 157–181 continue below
Rows 157–181 of 200
| # | ||||
|---|---|---|---|---|
| 157 |  Todd PinkstonPHIWR | 15 | 104.1 | 6.9 |
| 158 |  Jose CortezSFK | 16 | 104.0 | 6.5 |
| 159 | Kansas City Chiefs D/STKCDST | 16 | 104.0 | 6.5 |
| 160 |  Jay RiemersmaBUFTE | 16 | 103.5 | 6.5 |
| 161 |  Matt HasselbeckSEAQB | 13 | 103.0 | 7.9 |
| 162 |  Morten AndersenNYGK | 16 | 103.0 | 6.4 |
| 163 |  Ryan LongwellGBK | 16 | 103.0 | 6.4 |
| 164 |  Tony RichardsonKCRB | 14 | 102.6 | 7.3 |
| 165 | Washington Redskins D/STWASDST | 16 | 102.0 | 6.4 |
| 166 |  David SloanDETTE | 14 | 101.4 | 7.2 |
| 167 |  Richard HuntleyCARRB | 13 | 101.1 | 7.8 |
| 168 |  Mike AndersonDENRB | 16 | 100.4 | 6.3 |
| 169 |  Trung CanidateLARRB | 15 | 100.0 | 6.7 |
| 170 | Atlanta Falcons D/STATLDST | 16 | 100.0 | 6.3 |
| 171 |  Travis TaylorBALWR | 15 | 99.6 | 6.6 |
| 172 | Buffalo Bills D/STBUFDST | 16 | 99.0 | 6.2 |
| 173 | Detroit Lions D/STDETDST | 16 | 98.0 | 6.1 |
| 174 |  Donald HayesCARWR | 16 | 97.7 | 6.1 |
| 175 |  Terry AllenBALRB | 11 | 97.1 | 8.8 |
| 176 | Dallas Cowboys D/STDALDST | 16 | 97.0 | 6.1 |
| 177 |  Chad LewisPHITE | 15 | 96.7 | 6.4 |
| 178 |  Wesley WallsCARTE | 14 | 96.7 | 6.9 |
| 179 |  Lamont WarrenDETRB | 16 | 96.7 | 6.0 |
| 180 |  Martin GramaticaTBK | 14 | 96.0 | 6.9 |
| 181 |  John KasayCARK | 16 | 96.0 | 6.0 |
Rows 182–200 continue below
Rows 182–200 of 200
| # | ||||
|---|---|---|---|---|
| 182 |  Olindo MareMIAK | 16 | 95.5 | 6.0 |
| 183 |  Phil DawsonCLEK | 16 | 95.0 | 5.9 |
| 184 |  Joe NedneyTENK | 16 | 95.0 | 5.9 |
| 185 |  James AllenCHIRB | 16 | 94.2 | 5.9 |
| 186 |  Terance MathisATLWR | 16 | 93.9 | 5.9 |
| 187 |  Rian LindellSEAK | 16 | 93.0 | 5.8 |
| 188 |  Travis MinorMIARB | 16 | 92.9 | 5.8 |
| 189 |  Frank SandersARIWR | 15 | 92.3 | 6.2 |
| 190 |  Jason HansonDETK | 16 | 92.0 | 5.8 |
| 191 | Arizona Cardinals D/STARIDST | 16 | 92.0 | 5.8 |
| 192 |  Thomas JonesARIRB | 16 | 91.6 | 5.7 |
| 193 |  Tony MartinATLWR | 11 | 91.3 | 8.3 |
| 194 |  Ernie ConwellLARTE | 16 | 90.9 | 5.7 |
| 195 |  Jason BrookinsBALRB | 12 | 90.6 | 7.5 |
| 196 |  Chris Fuamatu-Ma'afalaPITRB | 14 | 90.0 | 6.4 |
| 197 |  Muhsin MuhammadCARWR | 11 | 87.5 | 8.0 |
| 198 |  Rob JohnsonBUFQB | 8 | 86.7 | 10.8 |
| 199 |  Shawn JeffersonATLWR | 15 | 86.4 | 5.8 |
| 200 |  MarTay JenkinsARIWR | 13 | 86.2 | 6.6 |
More leaders and tools
Week 17 leaders · 2026 leaders · 2025 leaders · 2024 leaders · 2023 leaders · Projections · Who should I start? · Waiver wire · Over Expected (luck) · Snap counts · Target share · Red zone usage · Fantasy points allowed · DST streamers · Kicker streamers · Trade value
Fantasy football data stories
How the game changed, told through the numbers.
- The Running-Back Cliff Barely Moved. Fewer Backs Reach It. In 2003, backs aged 28 or older got a third of NFL running-back carries.
- The Workhorse Running Back Is Back, but Only to the Late 2010s In the early 2000s the average NFL lead back got about 66 of every 100 running-back carries.
- The Kickoff Return Came Back. The Touchdowns Didn’t. For 13 years NFL rules pushed kickoffs into the end zone, and by 2023 only about one in five was returned.
How this works
Points come from each regular-season game’s box score, scored in the format you pick (PPR here by default; half PPR, standard, TE premium, 6-point passing TD, DraftKings and FanDuel under the scoring switch). Season pages add up every week so far; week pages show one week. Pts/G divides by games played; L3/G is the average of a player’s last three games in the range.
Snap % and target share count only the games a player played. Opp/G is targets plus carries per game; RZ counts targets and carries inside the opponent’s 20. Defense points allowed leave out points the opponent scored on its own defense or special teams (ESPN and Yahoo rule). Rostered % is the latest daily ESPN snapshot.
Sources: nflverse weekly stats, snap counts and play-by-playUpdated Fri, Oct 30, 12:38 PM ET
Frequently asked questions
How are fantasy points calculated?
From each game’s box score: 1 point per 10 rushing or receiving yards, 6 per rushing or receiving touchdown, 1 per 25 passing yards, 4 per passing touchdown, minus 2 per interception or lost fumble, 2 per two-point conversion. PPR adds 1 point per catch, half PPR 0.5 and standard none. Kickers score 3 to 5 per field goal by distance and 1 per extra point; defenses score sacks, takeaways, touchdowns and a points-allowed tier.
Which games count?
Regular-season games only. Week pages show one week; the season boards add up every week so far, and the week-range filter narrows them to any span, for example your fantasy playoff weeks.
Why rank by points per game as well as total?
A player who missed games trails on total points but may score more each week he plays. In our tests (2023 to 2026), ranking by per game changes 1 to 6 names in each position’s top 12 or 24, more than switching between PPR and half PPR does.
What do snap % and opportunity mean?
Snap % is the share of his team’s offensive plays he was on the field for, in the games he played. Opportunity is targets plus carries per game. Through week 7, opportunity predicted the rest of the season about as well as points per game did, so both are shown.
Can I use my league’s scoring?
Yes. Use More for TE premium, 6-point passing touchdowns, DraftKings or FanDuel scoring. Every table re-scores instantly, and your choice is remembered on every Edgehalla tool.